Contents
- 1 LOGICAL ALARMS
- 2 Overview
- 3 How to use
- 3.1 Create alarms
- 3.2 Create new alarms
- 3.3 Configure automated ticket creation
- 3.4 Create a copy
- 3.5 Search for alarms
- 3.6 Edit alarms
- 3.7 Delete alarms
- 3.8 Export alarms
- 3.9 Alarm test
- 3.10 Alarm Types
- 3.10.1 Type 1 – Last ROP value against threshold
- 3.10.2 Type 2 – Last N ROP values aggregated against thresholds
- 3.10.3 Type 3 – Total count of the N ROP values, if the value is greater/less than C
- 3.10.4 Type 4 – Difference in % of the last N ROPS aggregated Vs the last M ROPS aggregated against threshold
- 3.10.5 Type 5 – Difference in % of the last ROP Vs the last D days in the same ROP aggregated against threshold
- 3.10.6 Type 6 – Difference in % of the last N ROPS aggregated Vs the same N ROPS aggregated in the last D days against threshold
- 3.10.7 Type 7 – Difference in % of the last N ROPS greater/less than C1 aggregated Vs the same N ROPS greater/less than C2 aggregated in the last D days
- 3.11 Active Alarms
- 3.12 Alarms’ history
- 4 Use cases
LOGICAL ALARMS
Overview
Define the alarms that will monitor the network’s behavior with the Logical Alarms module. Each alarm monitors a set of elements in multiple levels comparing its performance against thresholds following several built-in algorithms. The module also monitors missing data with a specific set of KPIs. The alerts triggered by the alarm can be sent by e-mail to the users or teams or by SNMP to other monitoring tools.
It is important to highlight that this tool must be used with moderation, since its function is overloaded and affects the complete software, damaging other important tasks.
How to use
Log in to your NetChart account.

Create alarms
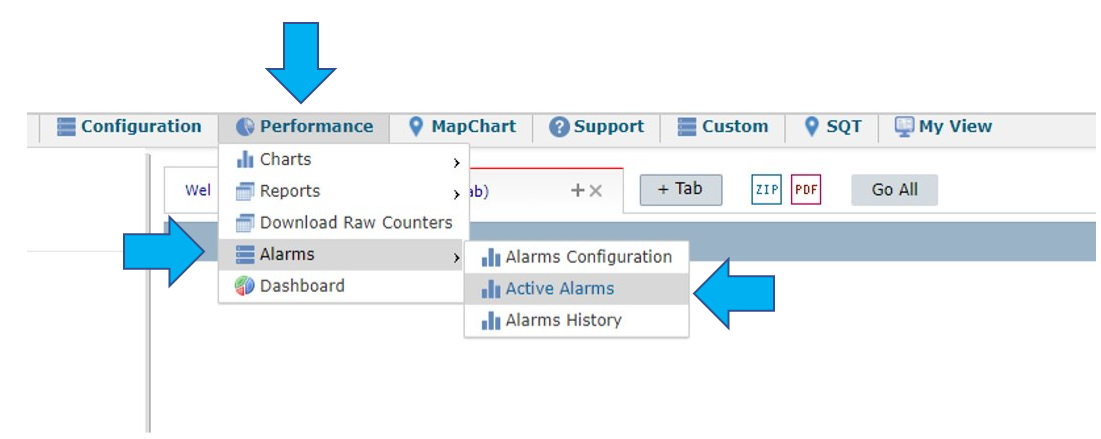
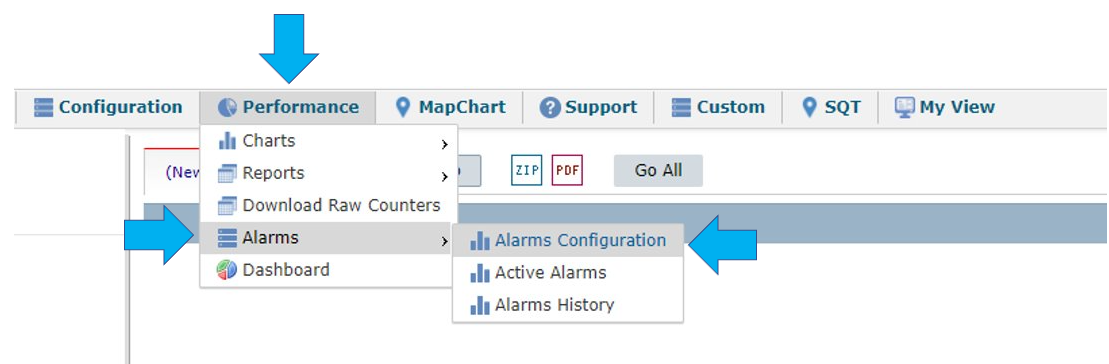
Select Performance > Alarms > Alarms Configuration to create alarms that monitor the network’s behavior.
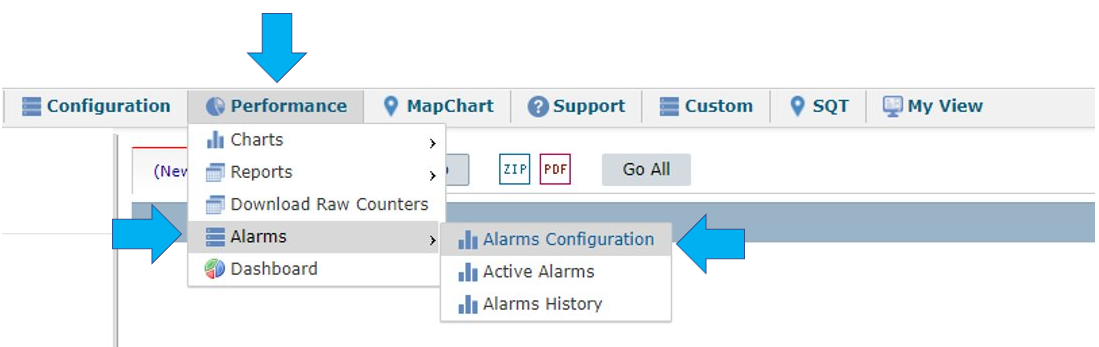
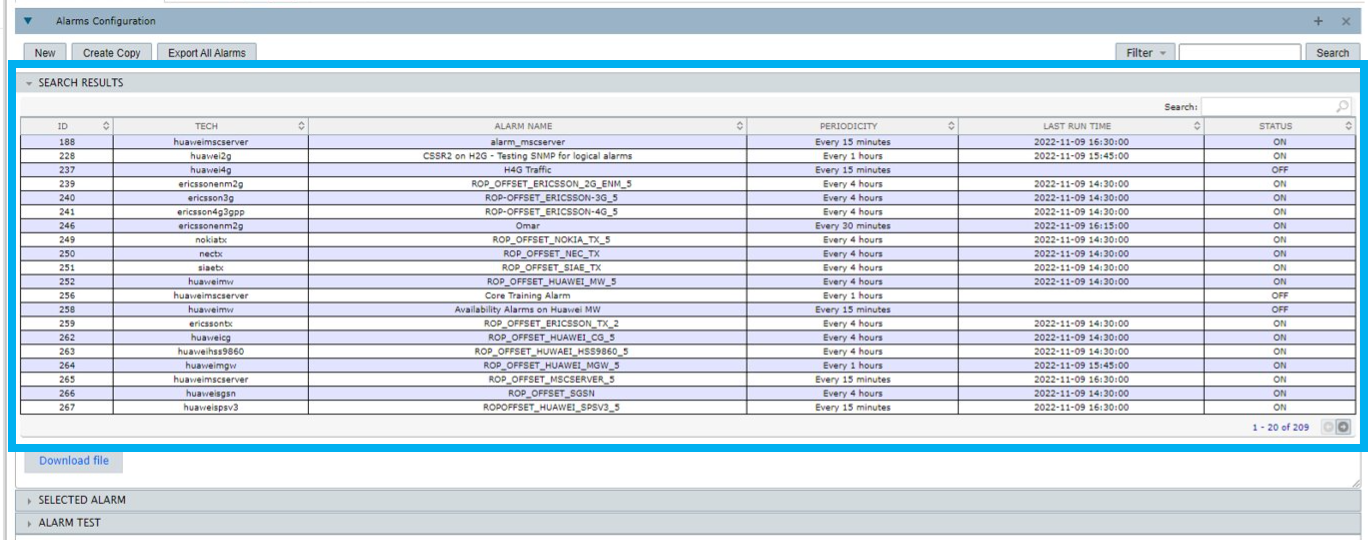
The SEARCH RESULTS slot shows all the alarms that are currently configured in the system.
Create new alarms
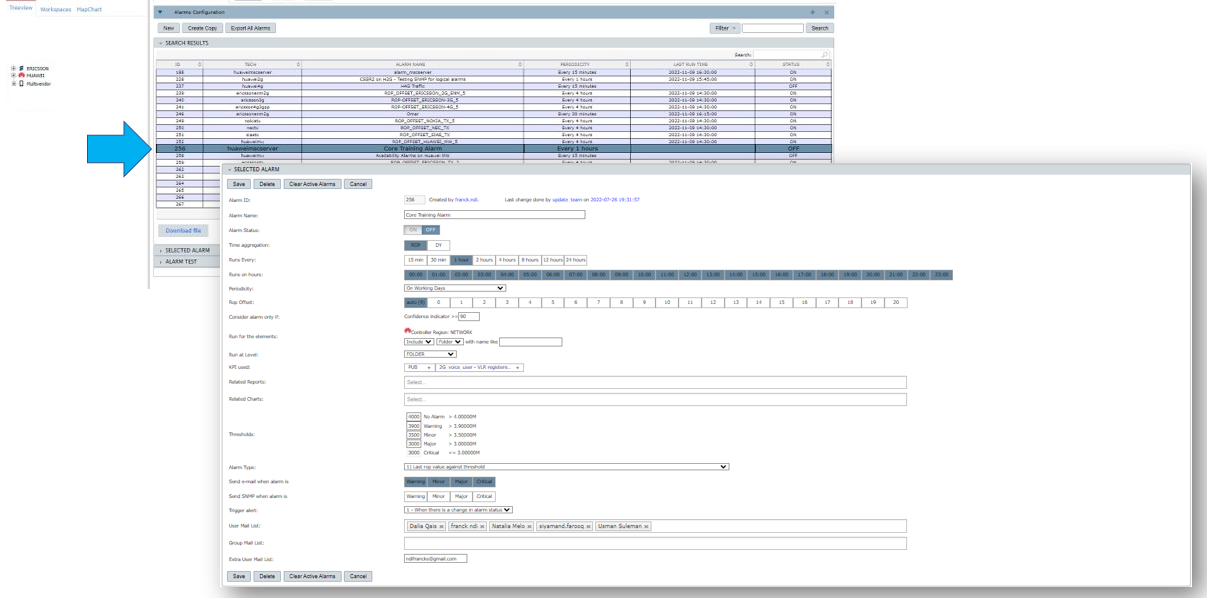
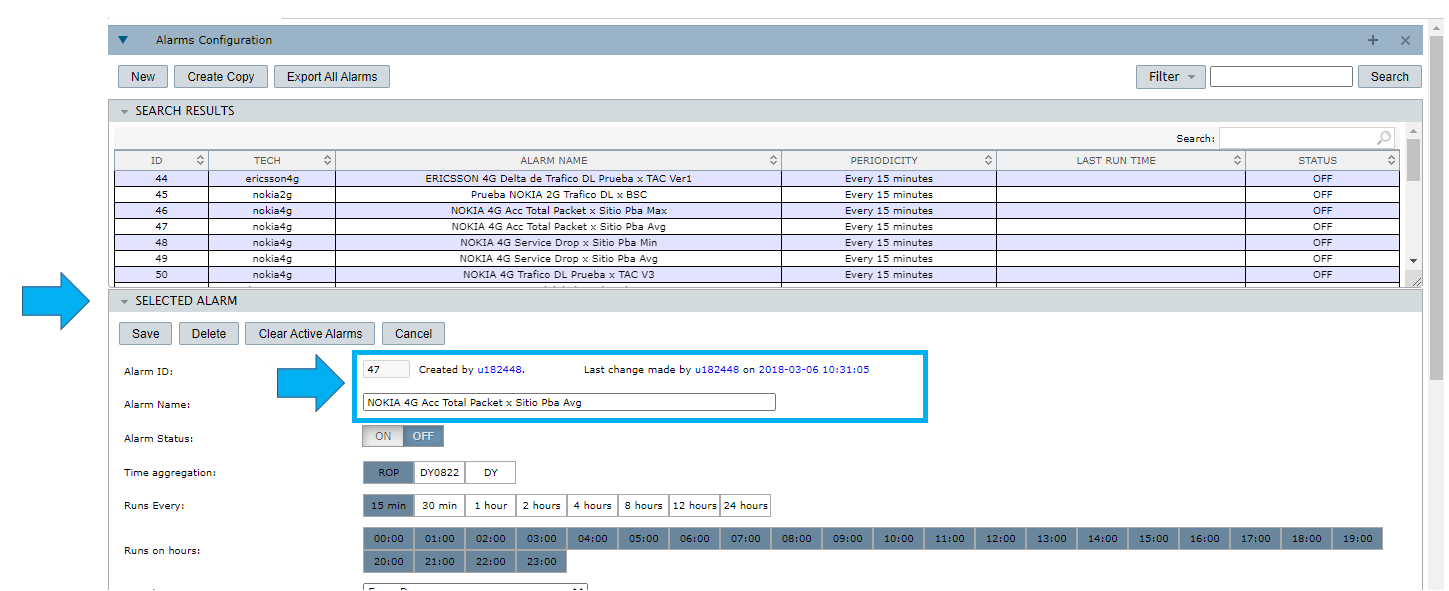
Choose the network elements in the treeview, and select New. View the alarm preferences in the SELECTED ALARM slot. View the elements selected in the Run for the elements field.
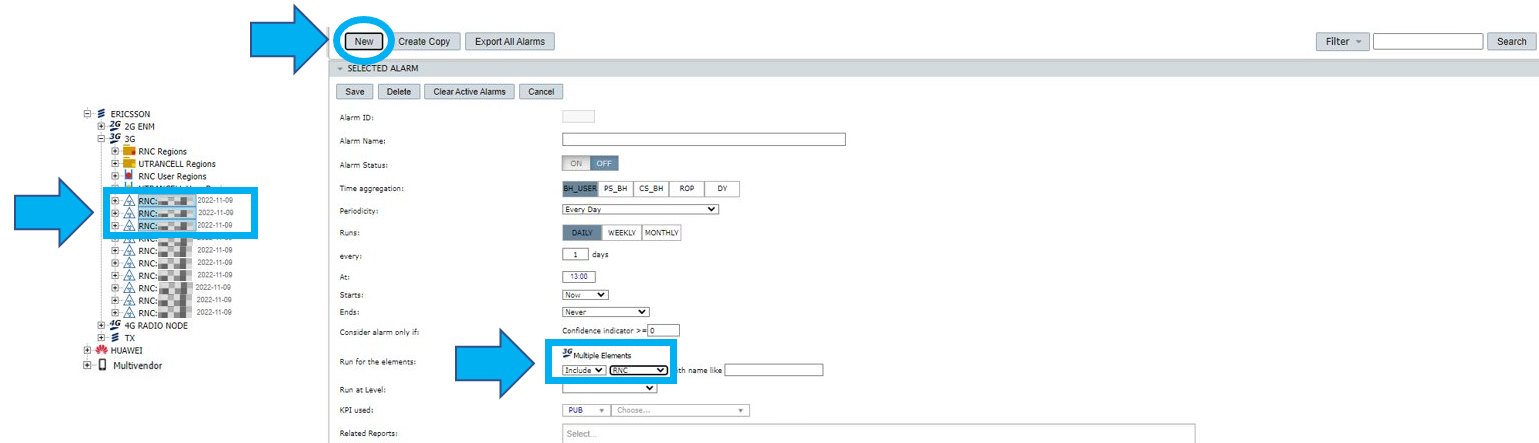
NOTE: Hold CTRL to select several elements.
NOTE: If you decide to change the network element, you can still choose other ones by clicking on their names while in the treeview. View the element(s) selected in the Run for the elements field.
Define the Alarm ID, the Alarm Name and the Alarm Status.
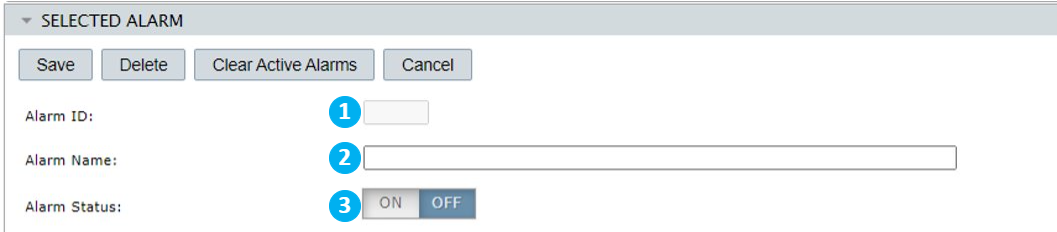
1 – The alarm ID is automatically created after you write a name for the alarm (field 2) and it cannot be edited.
2 – Write a name for the alarm.
3 – Select ON/OFF to activate or deactivate the alarm.
If you select the option ROP in Time Aggregation, follow the steps below:
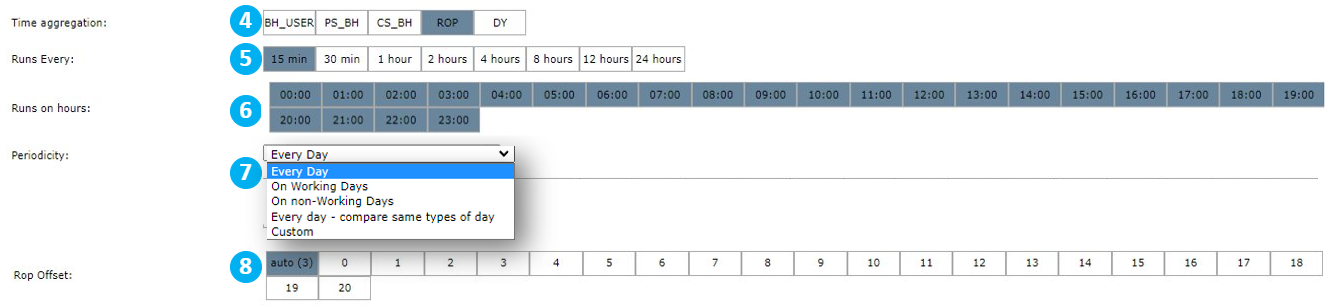
4 – Choose a time aggregation for the alarm. The options can vary among different projects.
5 – In Runs every, define a time interval for the alarm’s execution. Ex.: Every 15 minutes.
6 – In Runs on hours, choose the time of the day for the alarm’s execution. Ex.: All day.
7 – Choose the periodicity of the alarm’s execution. Ex.: Every day.
8 – Define the Rop Offset. After you have defined the Runs every, Runs on hours and Periodicity information, the Rop Offset will measure the time shift between the real time and the data used to check the alarm. This means that at the time of the execution, the alarm will check the data according to the time shift defined on Rop Offset. For example, if the Rop is 1 hour and Rop Offset is 3, the alarm will check the data from 3 hours ago. Or if the Rop is 15 minutes and Rop Offset is 3, the alarm will check the data from 45 minutes ago.
NOTE: When the option AUTO is active at the moment of the alarm execution, NetChart will consider the most recent ROP when at least 90% of the elements have any data available.
In case there is no new data, the alarms will run for the same set of data as the previous executions.
If you select the options BH_USER, PS_BH, CS_BH or DY in Time Aggregation, follow the instructions below:
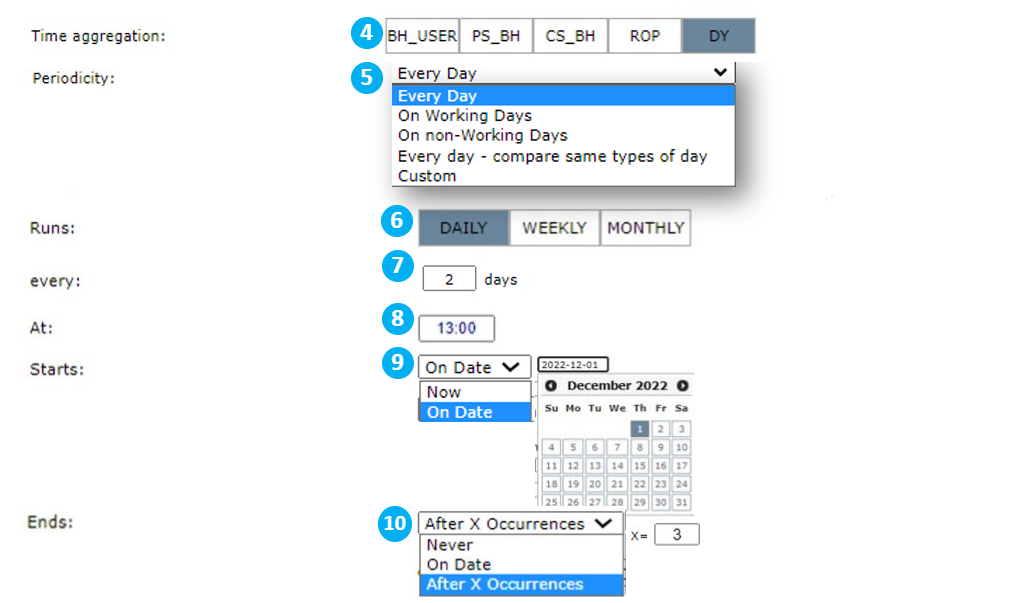
4 – Choose a time aggregation for the alarm. The options can vary among different projects.
5 – Choose the periodicity of the alarm’s execution. Ex.: Every day.
6 – Choose the frequency of the alarm’s execution. Ex.: Daily.
7 – Define the time interval of the alarm’s execution. Ex.: Every 2 days.
8 – Choose the time of the day for the alarm’s execution. Ex.: 13:00.
9 – Define when the alarm will start running.
Select:
- Now so that it begins right after you finish the configurations.
- On Date to select a specific date for the alarm to start running.
10 – Define when the alarm will stop running.
Select:
- Never so that it runs until you manually stop its execution.
- On Date to set a specific date for its last execution.
- After x occurrences to define a number of times the alarm will run before it stops. For example, substitute the x with a 3, if you want the alarm to stop running after 3 occurrences.
Continue following the instructions below to create alarms regardless of the time aggregation chosen.

11 – Write the confidence indicator number. The alarm is triggered only if it answers to the confidence indicator number, where this indicator formula is:
Confidence Indicator = 100x(SUM(NUM_ROPS)/(MAX(NUM_ROWS_AT_CM)x (NUM_ROPS))
It multiplies the total number of ROPS (considering the time duration of 1 ROP as set by the user) by 100 (considering it is a percentage). Then, it divides this result by the maximum value of the multiplication of the number of lines in the CM table by the total number of considered ROPS (the same as the numerator).
where:
NUM_ROPS = amount of ROPs analyzed in the alarm. It may vary depending on the configuration of each type of alarm. For example, in type 2, the user can choose to analyze the last 4 ROPs. So, in this case, NUM_ROPS = 4.
MAX(NUM_ROWS_AT_CM) = total number of elements in the network. It is calculated based on CM data.
NUM_ROPS = number of lines/elements found by NetChart when executing alarm KPI.
So, consider the situation in which there a maintenance is going to happen in a determined location on the network.
In this condition, it is expected that the user sets the confidence indicator as 80 f or example. So, the system will only consider this specific alarm when NetChart has 80% of available data and won’t trigger the alarm indicating – in this example – missing data for the related area. It means that if there is only 10% of available data in the net, the alarm will run normally if it is set in zero.
When it is set in 0 (zero), the system considers any number (different from zero) of available data to run the alarm.
Example:
Consider a region where there are 10 ROPs (result of periods, normally 15 minutes), 10 elements and suppose NetChart found only 8 elements when running the defined KPI. Then, according to the formula:
100x(SUM(NUM_ROPS)/(MAX(NUM_ROWS_AT_CM)x (NUM_ROPS))
100*(10/(10*8)) = 8%
Continue following the steps below to create alarms.
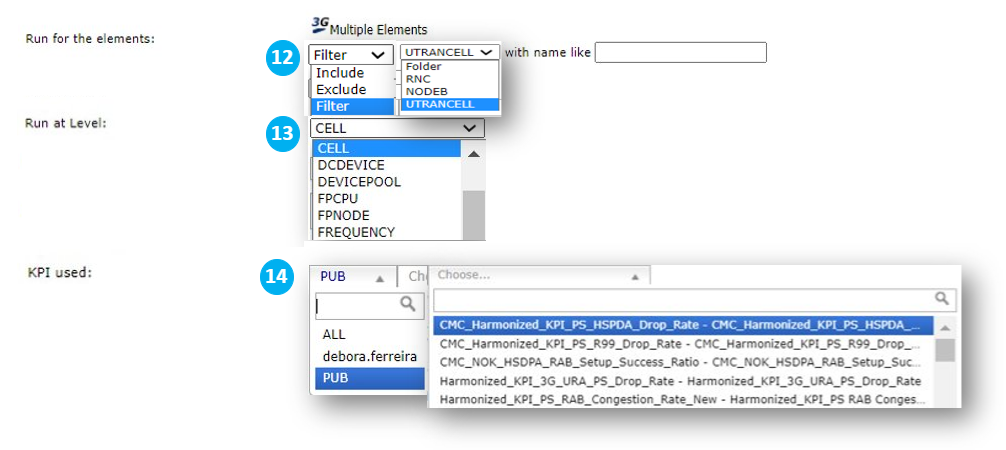
12 – See the elements selected and choose the ones for which the alarm will be set.
Select:
- Include when you want to include other elements in the alarm’s execution, in addition to what was selected in the treeview.
- Exclude when you want to select a region or a set of elements and you want to exclude one or more elements from the alarm’s execution.
- Filter when you want to select a region or a set of elements and you want the alarm to consider only some of the elements in the execution.
- With name like to specify a pattern that is present in the elements’ name. Ex.: typing ABC will select all the elements that have ABC in their names.
13 – Choose the alarm’s topology level. Ex.: cell level, frequency level, etc.
14 – Choose the KPIs visibility – Public, All or Private. Choose the KPIs from the selected visibility list.
Continue following the steps below to create alarms.
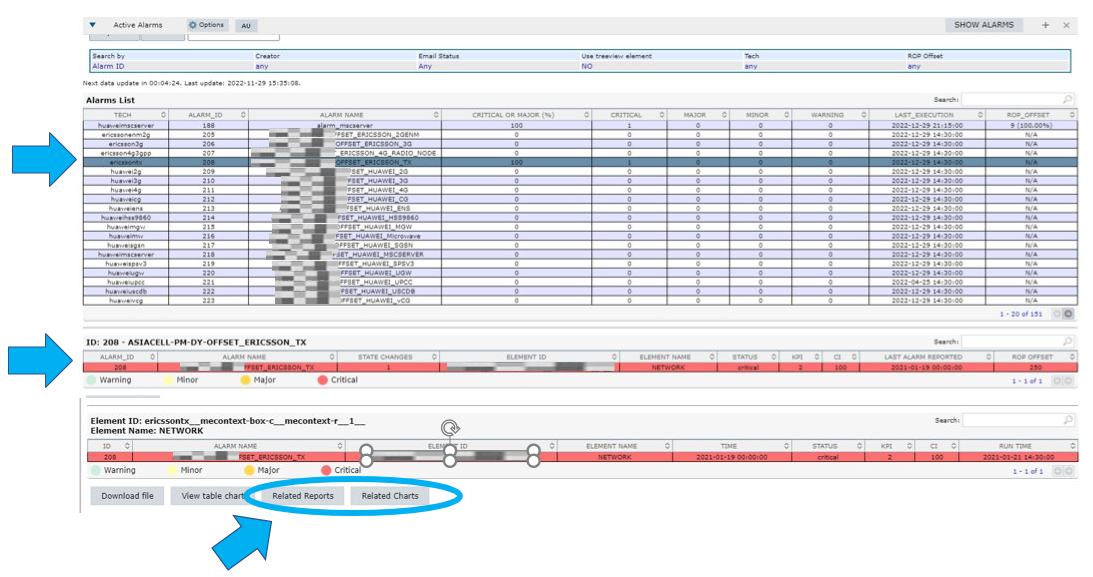
15 – Use the Related Reports and Related Charts fields to select reports and charts that are related to the alarm.
Select Performance > Alarms > Active Alarms.
Select an active alarm in the Alarms List slot. Double-click on the alarm opened in the second slot. Select Related Reports or Related Charts in the third slot so that NetChart runs the report or charts for the alarmed element(s). Use this feature to observe if the alarmed element caused the deterioration of any KPI used in these reports or charts, for example.
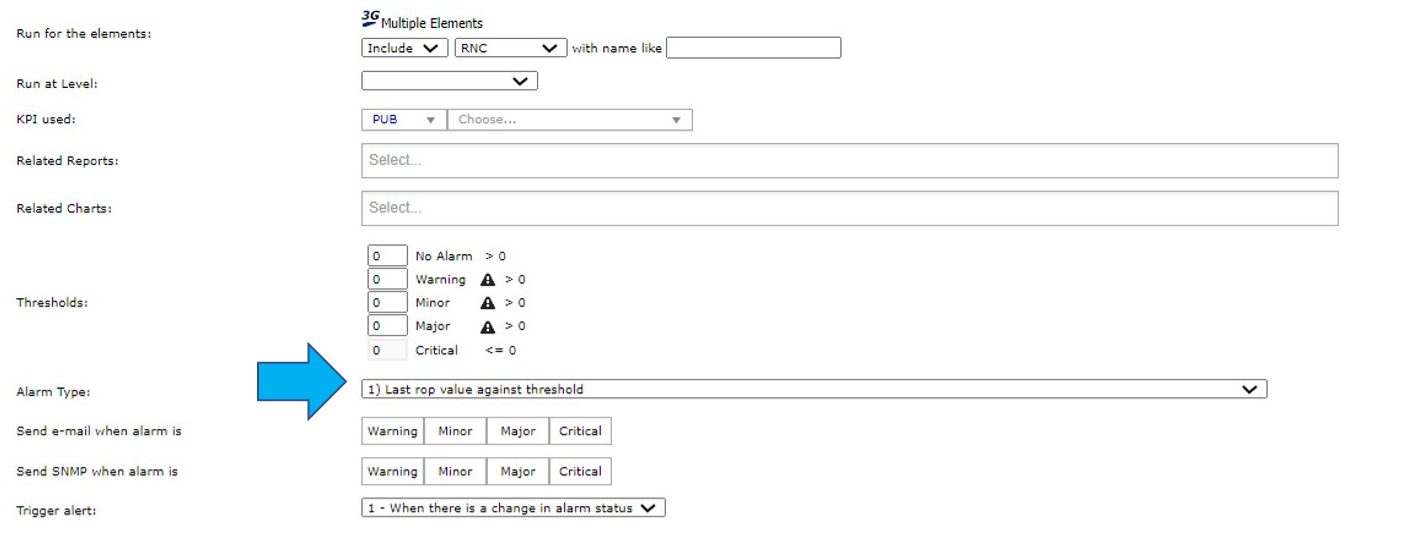
Define the Thresholds and Alarm Type.
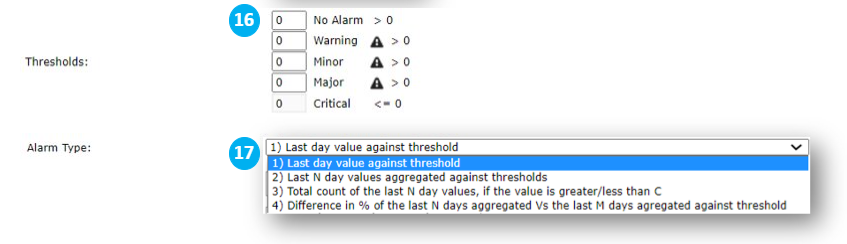
16 – Define the criticality limits of the alarm related to the selected KPI. For example, write 3 in Warning if you want the alarm criticality to be defined as Warning for results over 3.
17 – Define the alarm type.
NOTE: To learn more about types of alarms, read the section Alarm Types.
Decide when to receive an alarm notification.
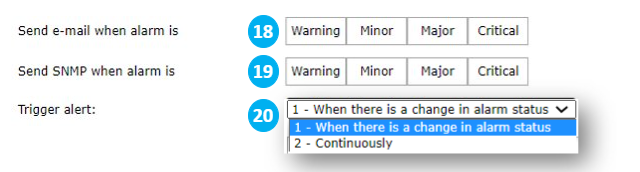
18 – Select the alarm’s severity. Receive an e-mail when the alarm reaches the selected levels.
If one or more severities are selected, a new section will appear:
19 – Select the alarm’s severity. Receive an SNMP when the alarm reaches the selected levels.
20 – Define when an alert will be triggered.
Select:
- When there’s a change in alarm status to receive an e-mail only if there is a change in the alarm status.
- Continuously to receive an e-mail even if the alarm status remains the same.
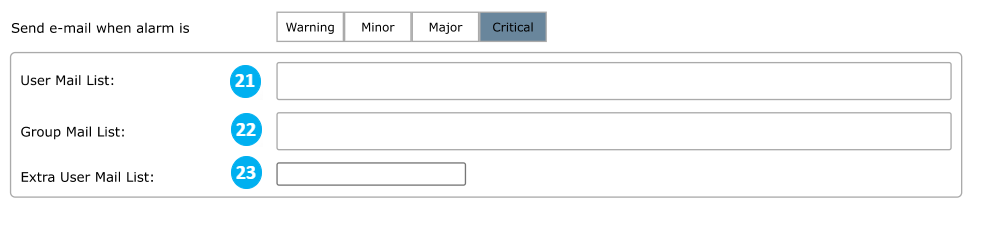
Decide who will receive the alarm notifications.
21 – Select individual users to receive the alarm by e-mail.
22 – Insert a recipients’ group in the e-mail list to receive the alarm by e-mail.
23 – Type in the extra user e-mail list. Write the e-mail addresses separated by commas.

24 – Define if the alarm should automatically create a ticket in an external tool when triggered. Learn about this option in the Configure automated ticket creation section.
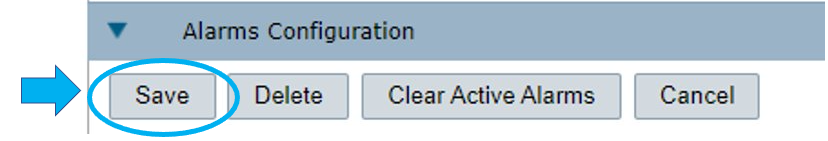
Click on Save to create the alarm.

The option Clear Active Alarms cannot be selected when you are creating an alarm. Learn about this option in the Edit alarms section.

Configure automated ticket creation
NetChart can integrate with external ticketing tools to automatically create a ticket when an alarm is triggered.
The Create a ticket when alarm is triggered checkbox is enabled in NetChart once this feature is acquired for the project and the integration is set up with the assistance of Bwtech’s support team. Contact your project administrator for more details.
After setting up the integration, follow the steps below.
Check the Create a ticket when alarm is triggered box.
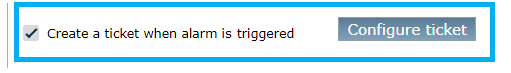
A new window will appear with the ticket configuration.
Select the alarm’s severity. NetChart will automatically create a new ticket in the integrated ticketing tool when the alarm reaches the selected levels.
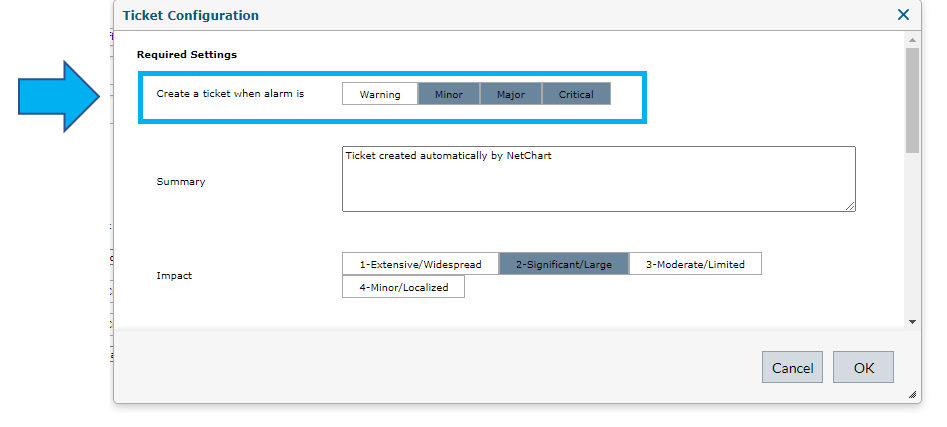
The parameters available for configuration will match the ticket’s properties in the ticketing tool, and they may vary for each project.
The settings are grouped into two sections: Required Settings and Optional Settings. The values defined for these features will be attributed to the tickets created by NetChart for this alarm.
Define all items in Required Settings and click on OK.
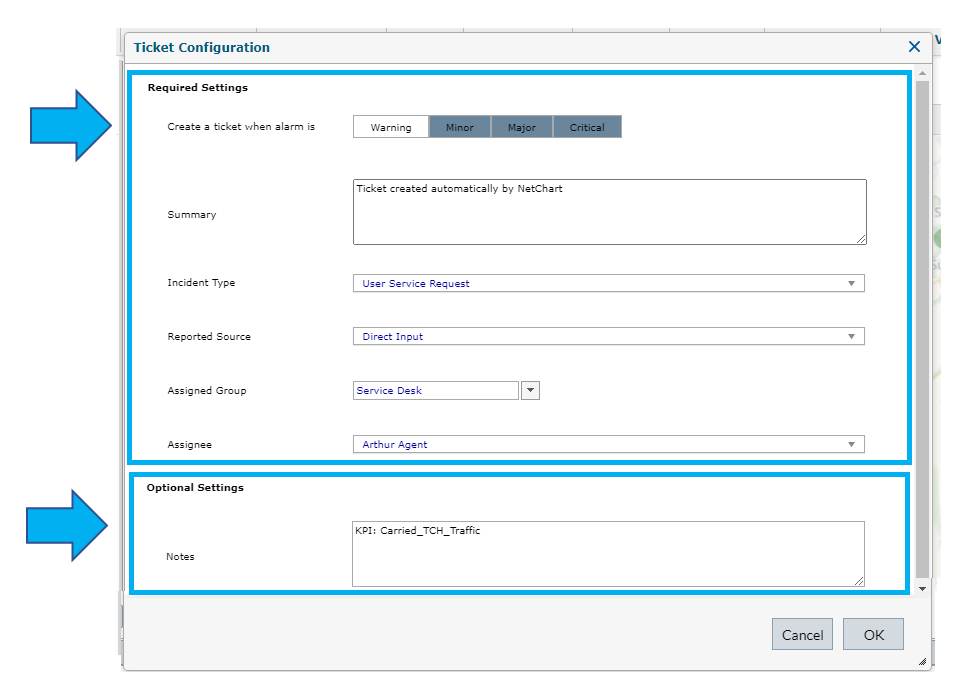
NOTE: All information about the alarm occurrence, such as time, triggered elements, KPI value, severity e previous severity will be attached to the created ticket. The ticket parameter that will receive this information depends on the integration settings. Usually, it is appended to the Notes field.
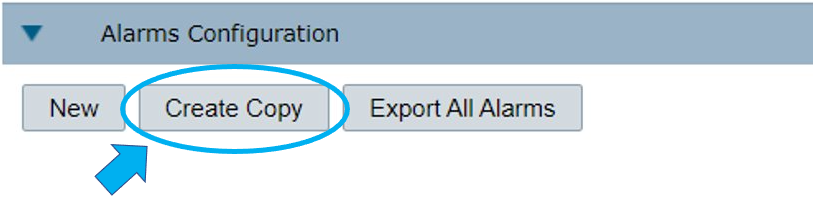
Create a copy
Create a copy of an existing alarm to keep most of its information and edit just a few items.
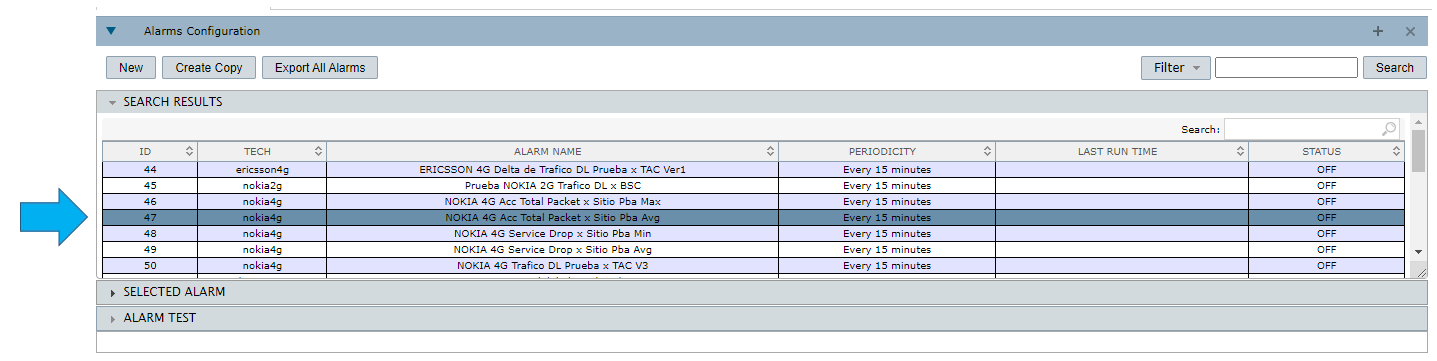
Select the desired alarm. View its preferences in the SELECTED ALARM slot.
Select Create Copy.
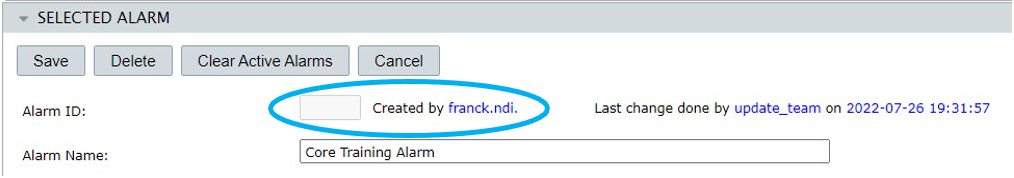
Notice that the Alarm ID field is empty. This means that you have entered the Create Copy mode.
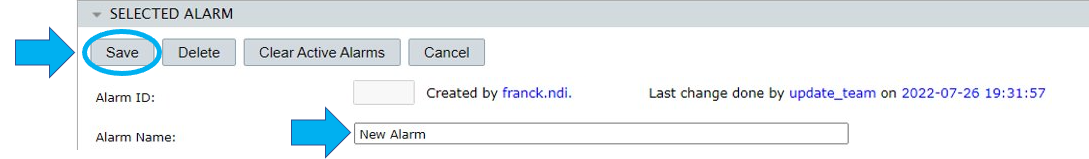
Change the Alarm Name, make the other desired changes and select Save.
The message Alarm ‘name of the alarm’ was successfully saved confirms the creation of the copied alarm.
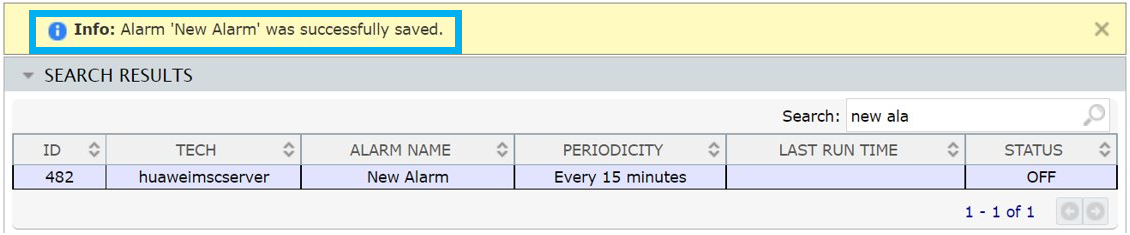
Find the copied alarm in the list of available alarms or search for it by typing its name in the Search field.
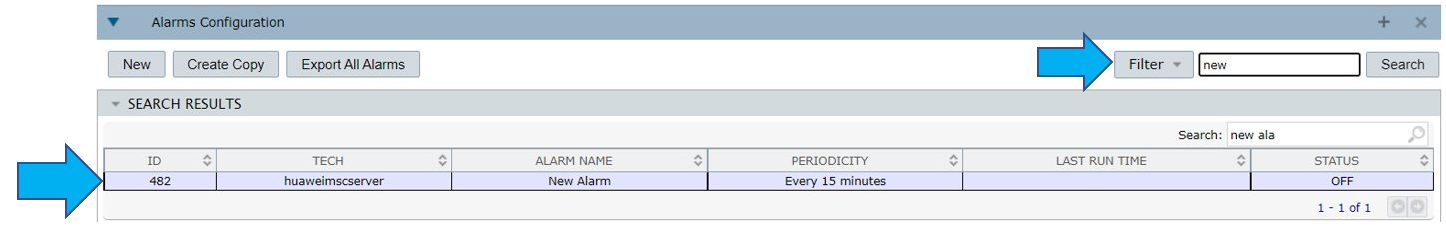
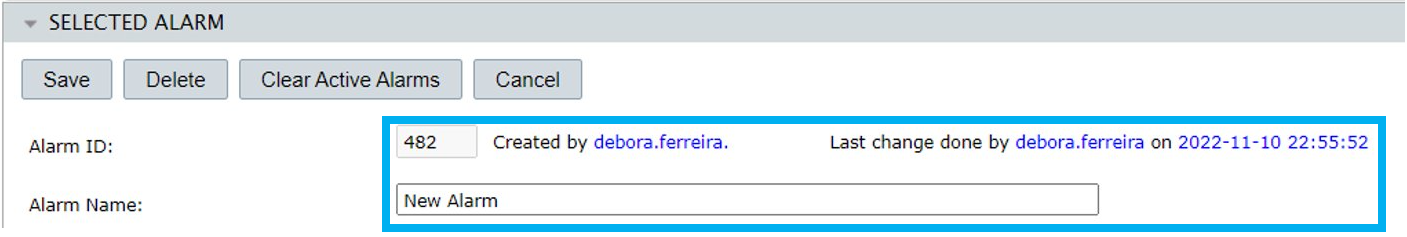
Click on the new alarm to view its Alarm ID number, its creator’s name, the name of the user who made the last change in it and the date of the last change.
Search for alarms
There are two types of Search.
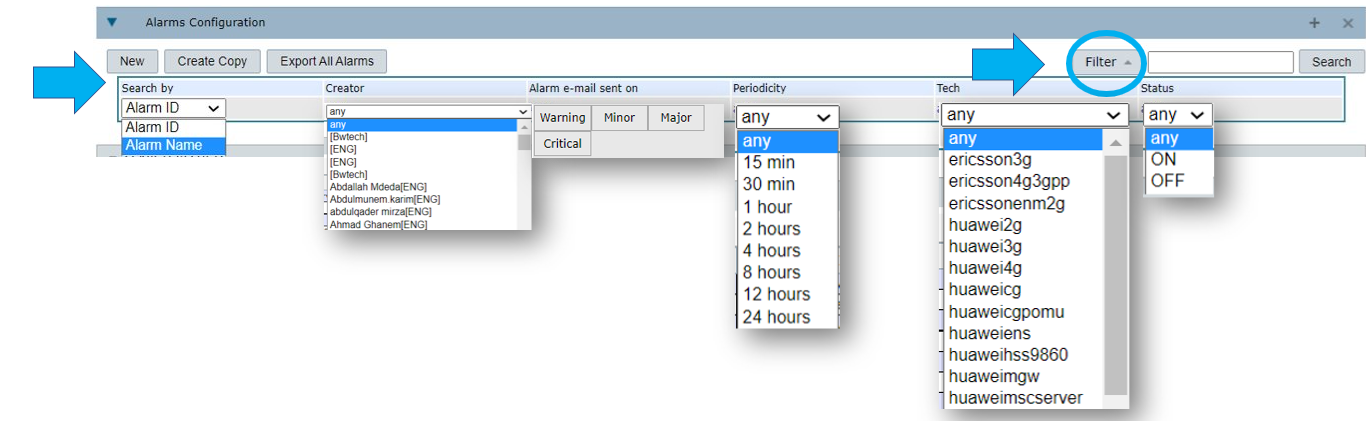
1 – The first option does a more thorough search as you filter for alarms based on their Name/ID, Creator, Alarm e-mail sent on, Periodicity and Status.
Select Filter, double-click on the filters you want to apply, choose the filtering options and select Search.
NOTE: This option saves the filters applied and every time you open the Alarms Configuration menu, you’ll see the alarms with the filters applied. To reset the list of alarms, select Filter and select any for the filters that have this option.
Edit alarms
In the alarms’ list, select the alarm you want to edit. An icon next to Alarms Configuration shows that the system is loading the selected alarm.
View the alarm preferences in the SELECTED ALARM slot.
Edit the desired preferences in their corresponding fields. Follow the same steps as the ones to create a new alarm. Read the Create new alarms section to learn more about how to fill in each field.
Select Save to apply the changes.
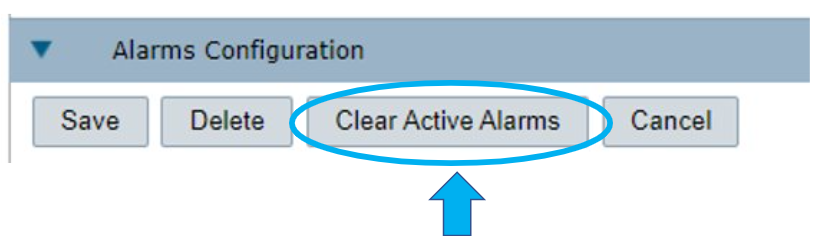
After editing an alarm, use the option Clear Active Alarms to cancel other active alarms related to this one.
For example: An alarm was created with a wrong KPI and it was wrongly activated as Critical. Correct the KPI and select Clear Active Alarms. This means that the previous states reported by the alarm won’t appear in the Alarms List slot anymore. This option sends an email to all the selected recipients so they know that the alarms have been cleared.
Delete alarms
Select the desired alarm. View it in the SELECTED ALARM slot and select Delete.
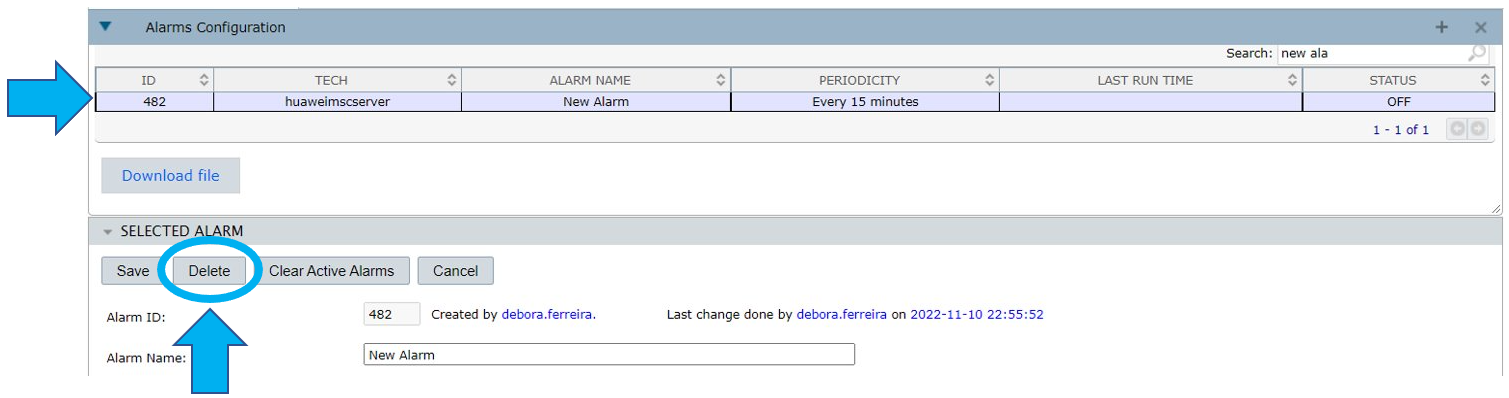
NOTE: This action can’t be undone.
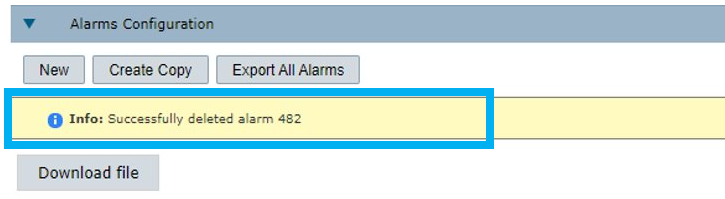
The message ‘Successfully deleted alarm (alarm ID)’ confirms the action.
Export alarms
To export detailed information about the configuration of the alarms, select Export All Alarms, then select Download file.
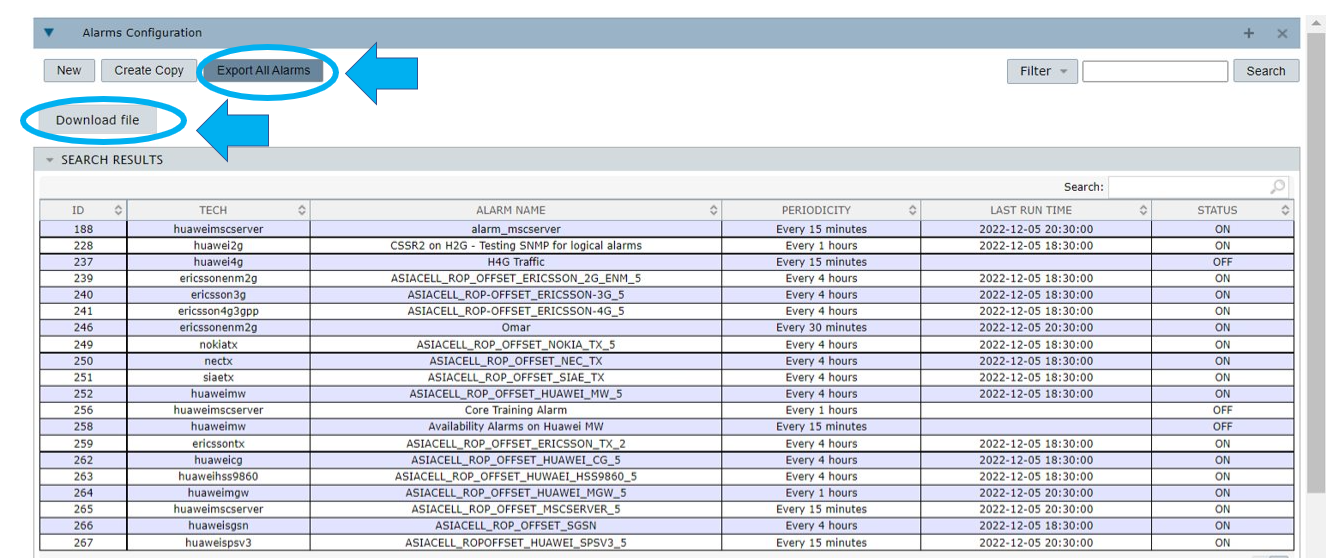
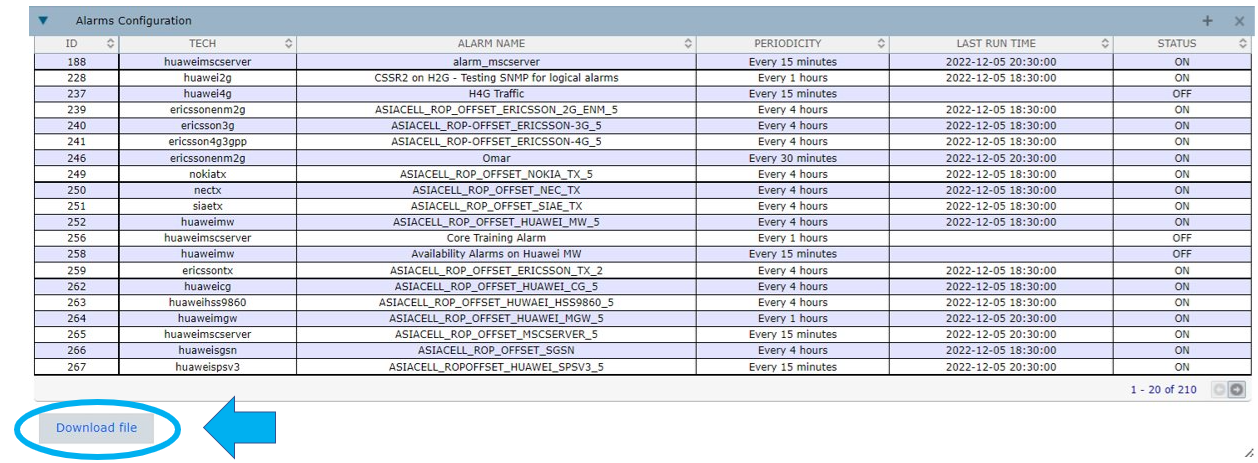
To export an alarms summary, select Download file below the list.
The information in this file is the same that you view in the SEARCH RESULTS slot, that is, ID, TECH, ALARM NAME, PERIODICITY, LAST RUN TIME and STATUS.
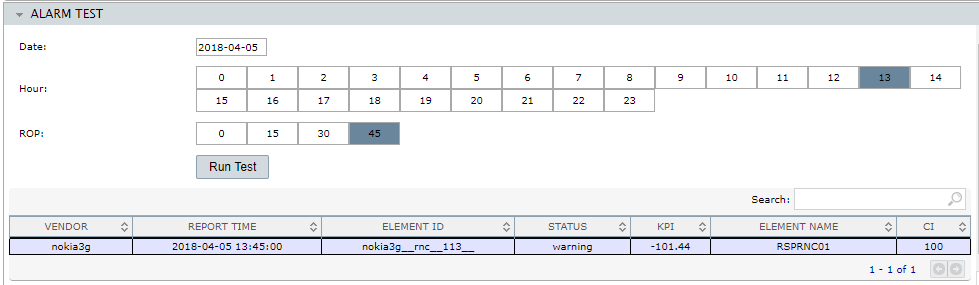
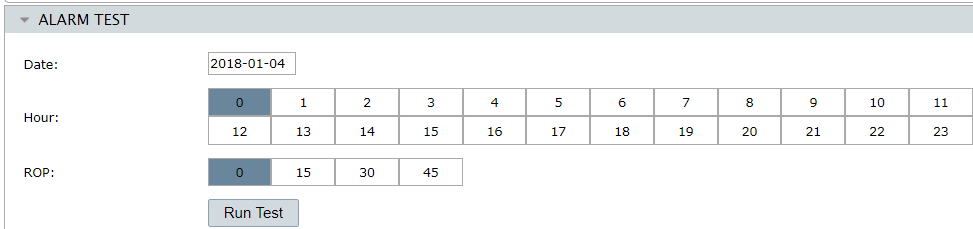
Alarm test
In order to validate the configuration of an alarm, use the ALARM TEST option to check the alarm’s behavior and result at any given past date and ROP.
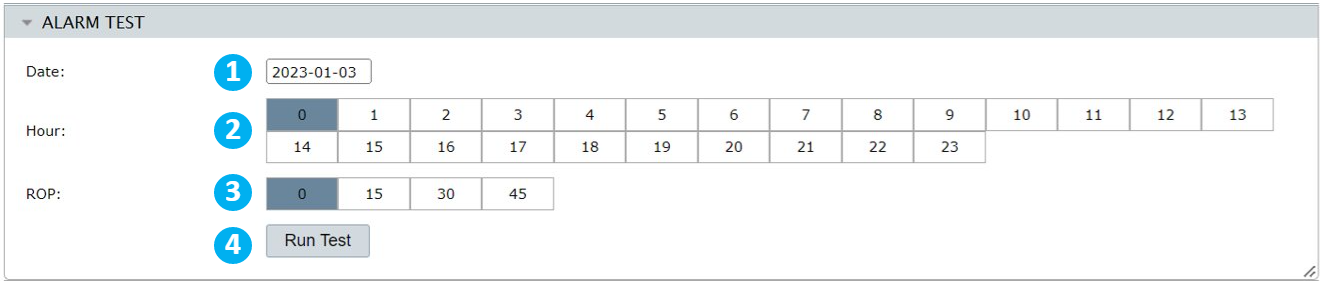
1 – Select a past date for the alarm’s test execution.
2 – Select the hour.
3 – Select the minutes considering the ROP offset. For example: If the ROP is 30 minutes, the options 0 and 15 will refer to the first ROP, while the options 30 and 45 will refer to the second ROP of the hour. If the ROP is 1 hour, skip this option.
4 – Select Run Test.
Alarm Types
There are 7 different types of alarms.
Type 1 – Last ROP value against threshold
This is the simplest alarm type.
In this option, the system uses the last ROP value generated by NetChart related to the selected element/technology and, according to the defined thresholds values and the set configuration in the fields Send e-mail when alarm is and Send SNMP when alarm is, an e-mail and/or an SNMP is sent to the users to alarm the situation.
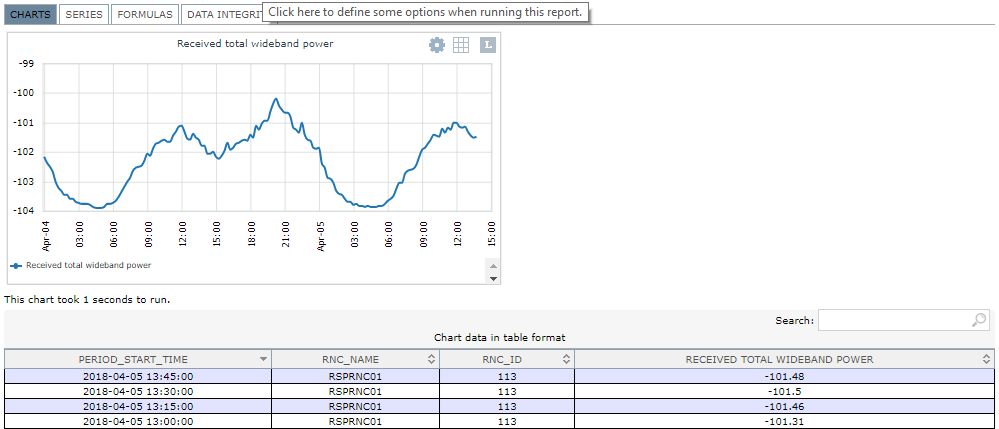
- Example:
Element: NOKIA RSPRNC01
KPI: RTWP
Aggregation: RNC
Selected type: Last ROP
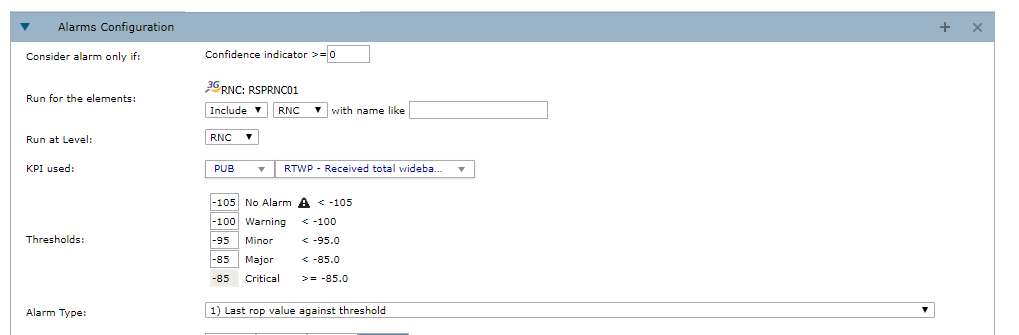
Calculated value: -101,48 (Warning – according to the set threshold).
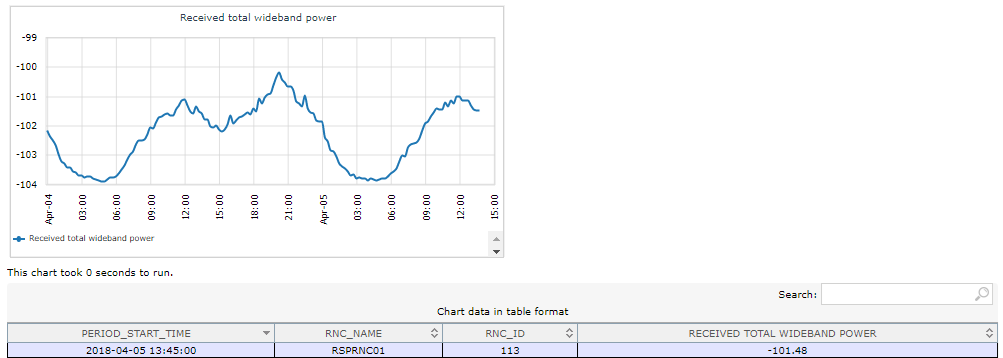
When simulating the alarm, the following image is shown:

In the case above, an email will not be sent. According to the configuration set, this alarm only sends an e-mail when the status is Critical, and, in this case, it shows Warning.
Type 2 – Last N ROP values aggregated against thresholds
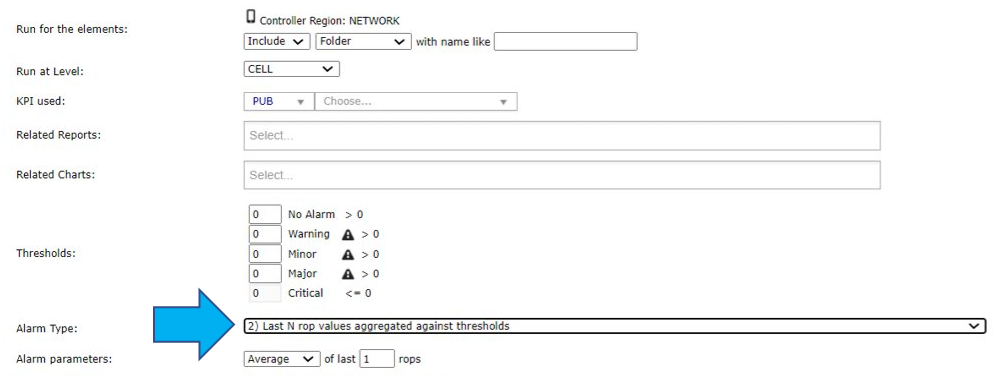
This alarm counts the minimum (user’s defined option) of N (user’s defined number) last ROPs and compares this value against the Threshold’s numbers.
- Example:
Element: NOKIA RSPRNC01
KPI: RTWP
Aggregation: RNC
Selected type: AVERAGE of the Last 4 ROPs
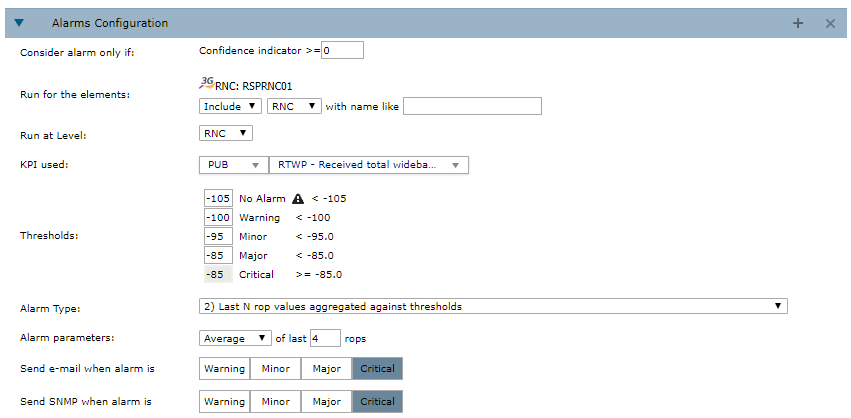
Calculated value: -101,438 (Warning – according to the set threshold).
When simulating the alarm, the following image is shown:
In the case above, an email will not be sent. According to the configuration set, this alarm only sends an e-mail when the status is Critical, and, in this case, it shows Warning.
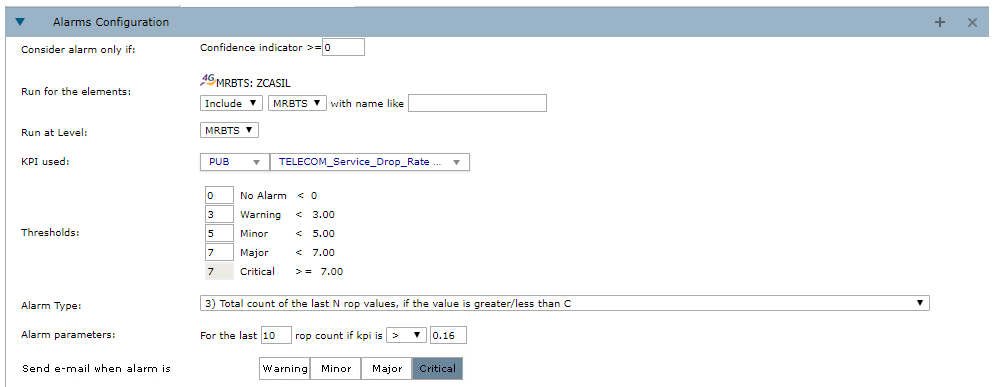
Type 3 – Total count of the N ROP values, if the value is greater/less than C
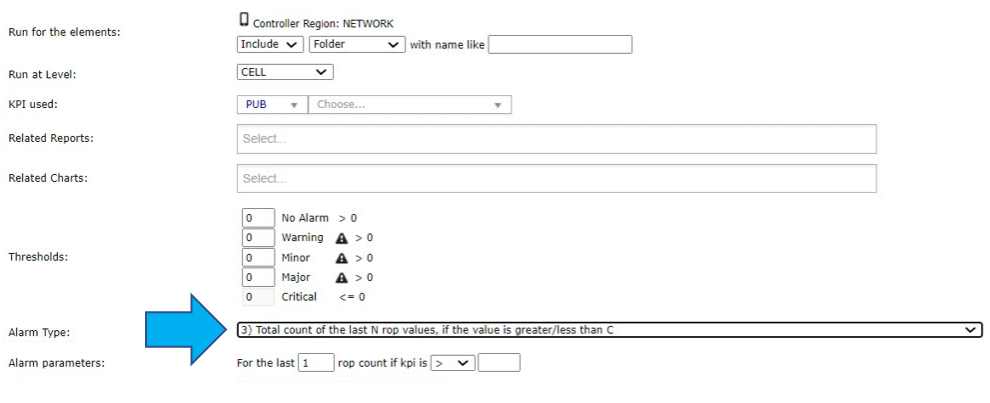
This alarm counts the total number of the last N ROPs and checks if the user’s defined KPI value is higher, lower, or equal to the threshold defined value.
- Example:
Element: 40012 – ZCASIL
KPI: TELECOM_Service_DROP_Rate
Aggregation: MRBTS
Selected type: 3) Total count of the last N ROP values, if the value is greater/less than C
Alarm parameters: For the last 10 ROPs, if the KPI is > 0,16
Example of KPI values:
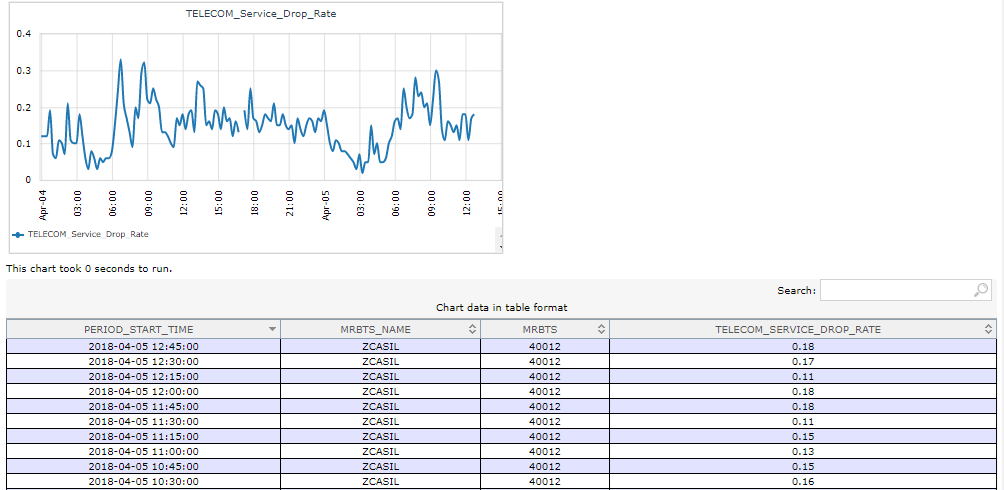
Calculated value for the last 10 ROPs: (0.18; 0.17; 0.11; 0.18; 0.18; 0.11; 0.15; 0.13; 0.15; 0.16) – There are 4 ROPs with values above 0.16.
So, according to the set threshold, it is Minor.
When testing the alarm, the following image is shown:
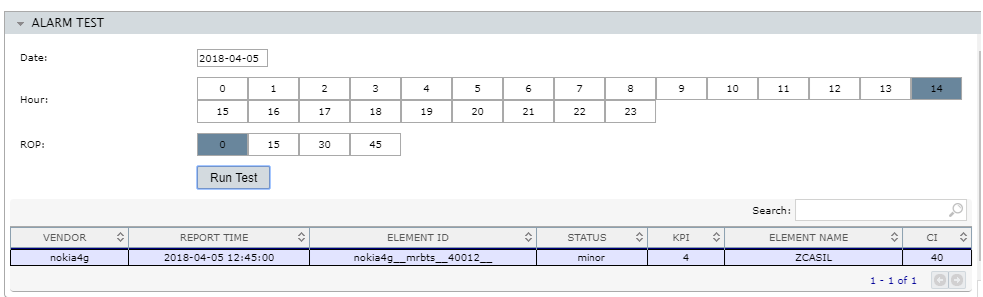
In the case above, an email will not be sent. According to the configuration set, this alarm only sends an e-mail when the status is Critical, and, in this case, it shows Minor.
Type 4 – Difference in % of the last N ROPS aggregated Vs the last M ROPS aggregated against threshold
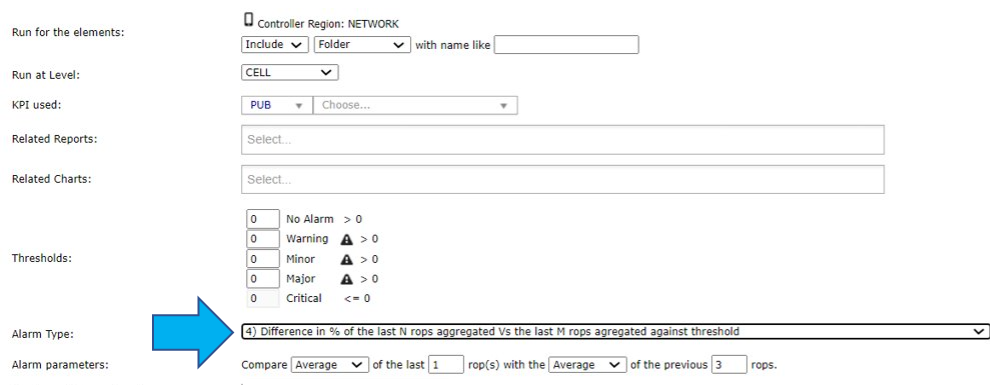
This alarm compares the difference, in percentage, of the average/sum/maximum/minimum (defined by the user) of the last N ROPs aggregated (defined by the user) versus the average/sum/maximum/minimum (defined by the user) of the last M ROPs aggregated against the threshold.
- Example:
A comparison (in percentage) between the minimum of the last 3 N ROPs versus the average of the other 3 ROPs before the minimum period is shown below.
Element: 692 – APVO02
KPI: Acessibilidade CS
Aggregation: RNC
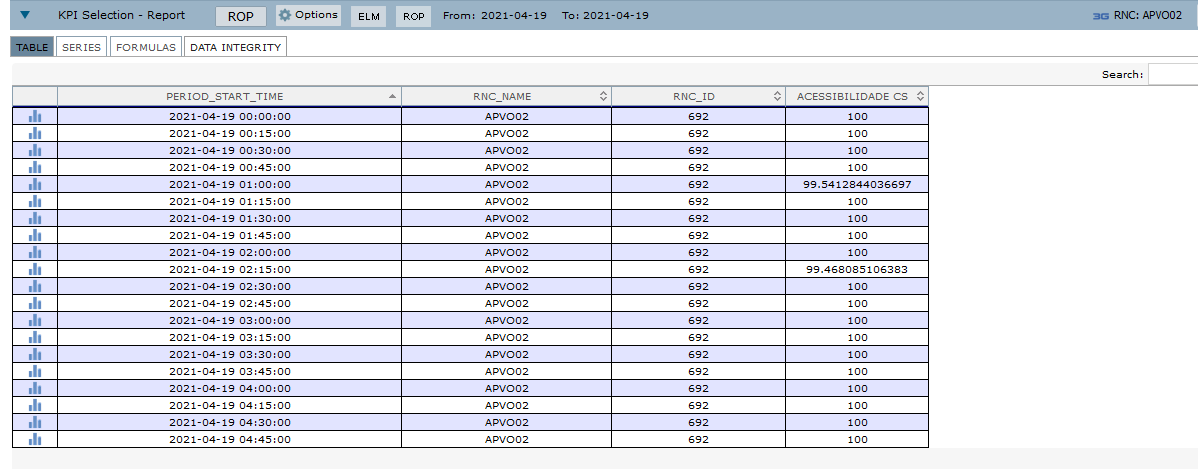
Selected type: MIN of the 3 last ROPs = 100
AVG of the 3 previous ROPs = 99,82
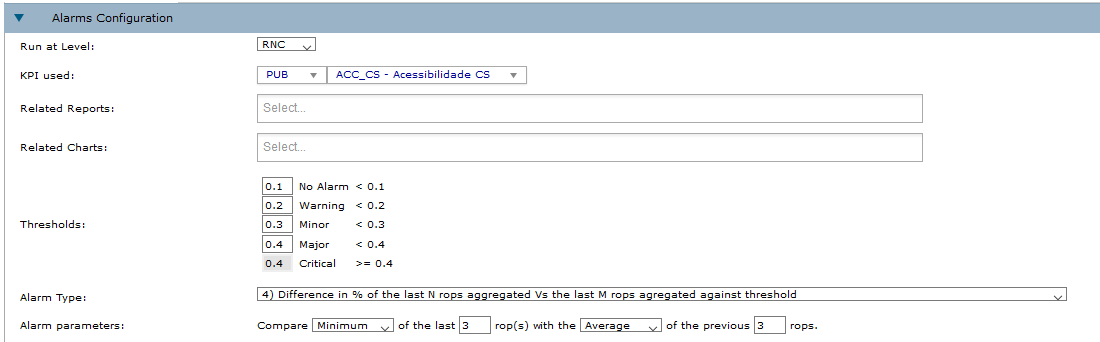
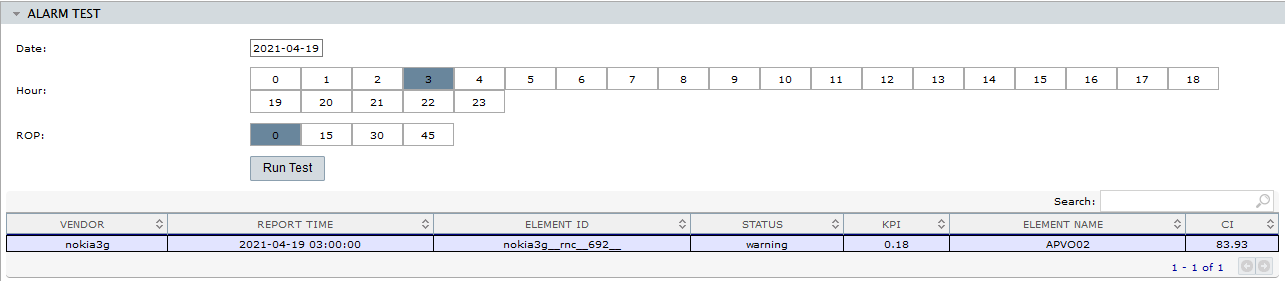
Calculated value: 0,18% (Warning– according to the set threshold).
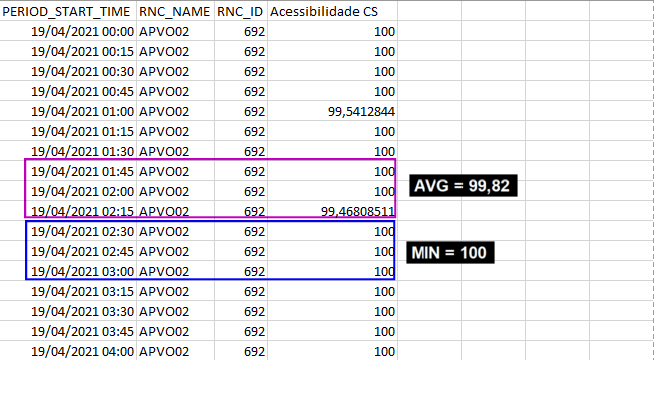
In this example, as the system has been configured to notify if the alarm reaches Warning, Minor, Major or Critical, an email will be sent.
Type 5 – Difference in % of the last ROP Vs the last D days in the same ROP aggregated against threshold
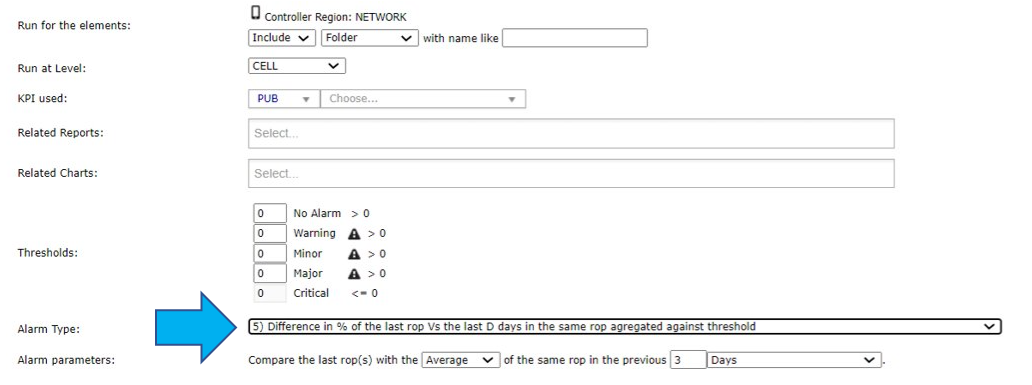
In this case, the alarm compares, in percentage, the last ROP chosen versus the average/sum/maximum/minimum (defined by the user) of the same aggregated ROP in N days (defined by the user) against the threshold.
- Example:
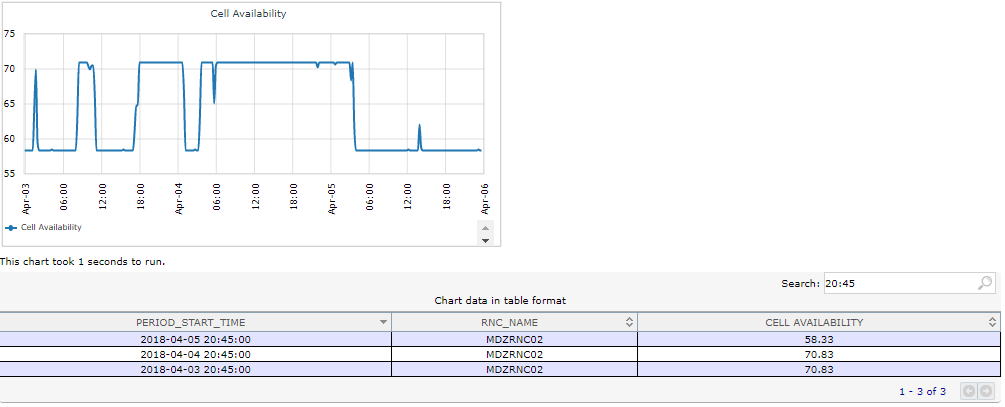
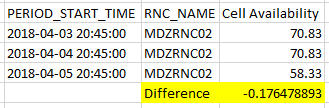
Let’s see a comparison between the last ROP to the minimum of the last 2 days.
Element: ERICSSON MDZRNC02
KPI: Cell Availability
Aggregation: RNC
Selected type: Last ROP = 58,33
AVG of the last 2 previous days = 70,83
Calculated value: -17,65 % ( Critical – according to the set threshold).
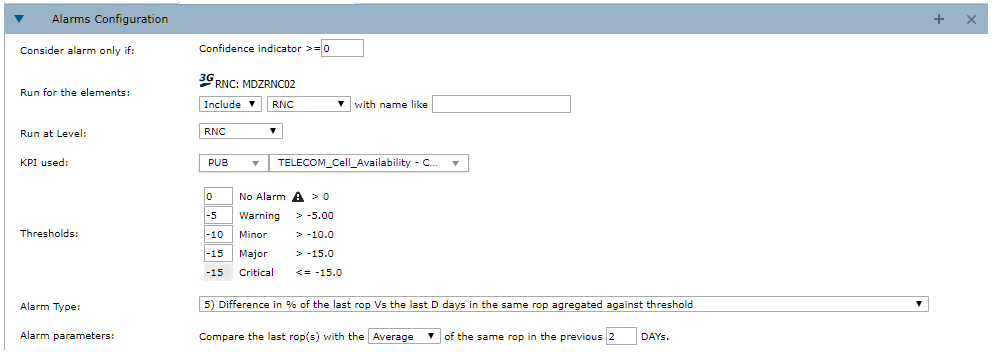
When testing the alarm, the following image is shown:
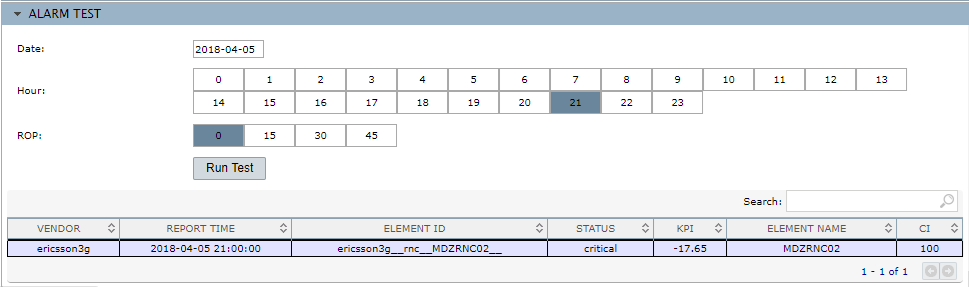
In the case above, an email will be sent. According to the configuration set, this alarm only sends an e-mail when the status is Critical, which is the case of this alarm.
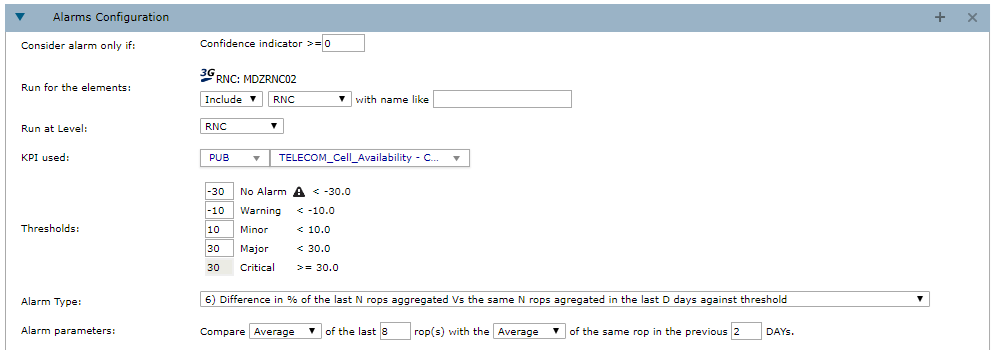
Type 6 – Difference in % of the last N ROPS aggregated Vs the same N ROPS aggregated in the last D days against threshold
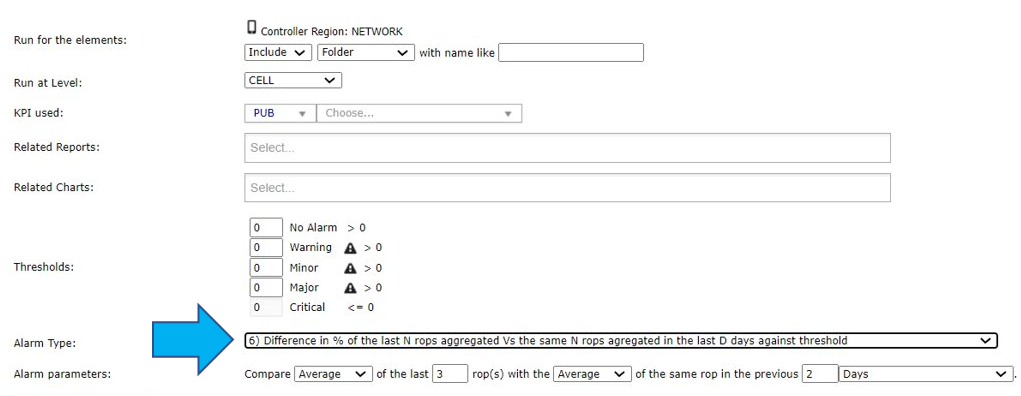
Similar to the previous type, in this case it is possible to compare the average/sum/maximum/minimum (defined by the user) of the N last ROPs (defined by the user) to the average/sum/maximum/minimum (also defined by the user) of the same ROP in a period of N days (defined by the user).
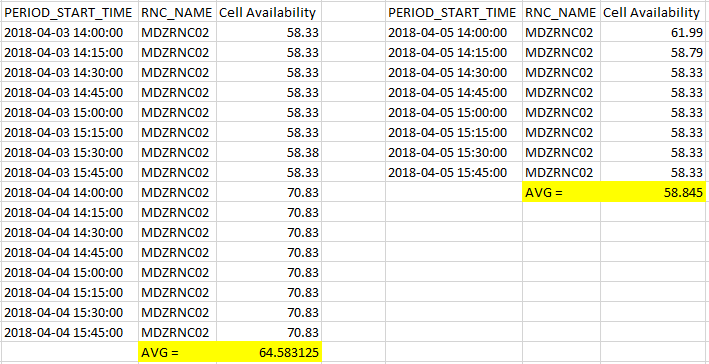
- Example:
Element: ERICSSON MDZRNC02
KPI: Cell Availability
Aggregation: RNC
Selected type: AVG of the last 10 ROPs = 58,845
AVG same ROPs in the last 2 previous days = 64,583
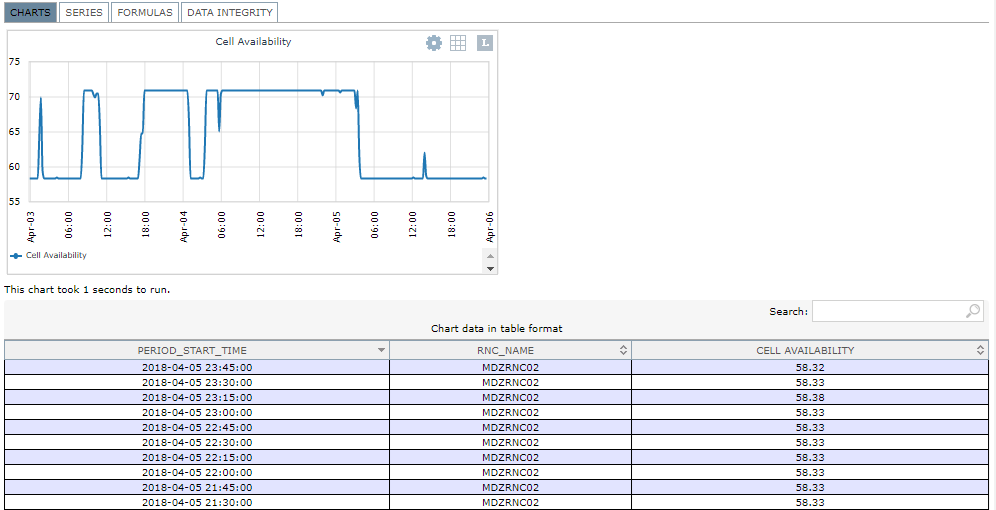
Calculated value: – 9,59 % (Minor – according to the set threshold).
When simulating the alarm, the following image is shown:
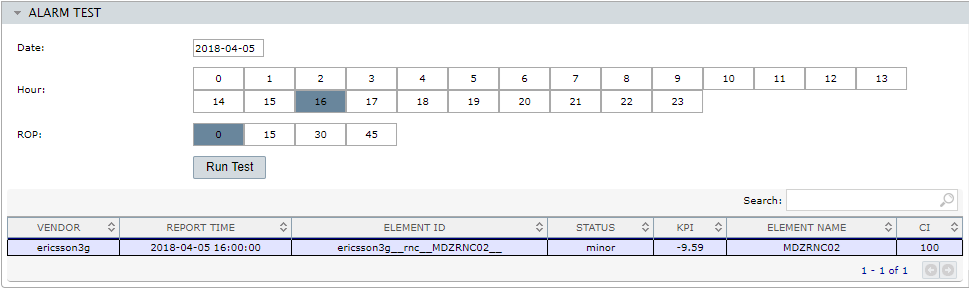
In the case above, an email will not be sent. According to the configuration set, this alarm only sends an e-mail when the status is Critical, and in this case, it shows Minor.
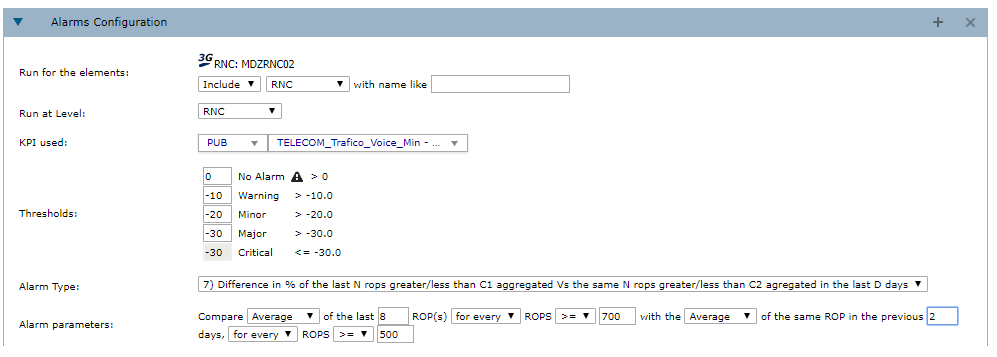
Type 7 – Difference in % of the last N ROPS greater/less than C1 aggregated Vs the same N ROPS greater/less than C2 aggregated in the last D days
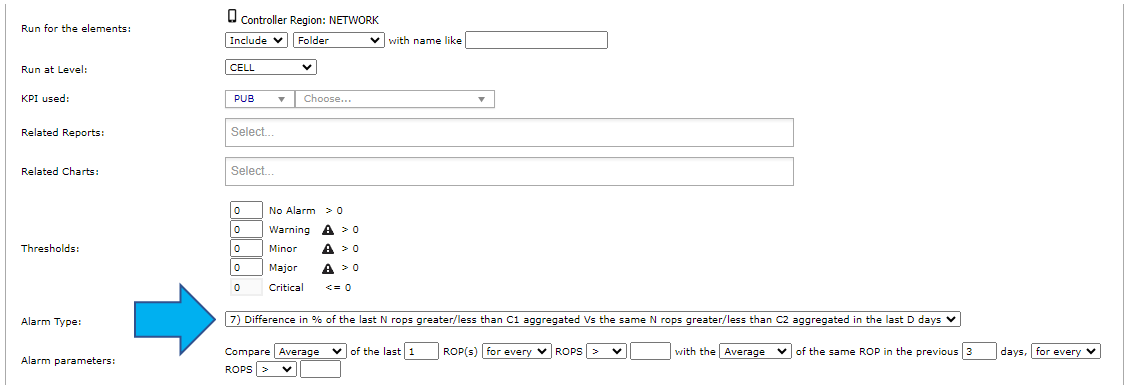
The last alarm calculates the percentage of the average/sum/maximum/minimum (defined by the user) related to the last N ROPs (defined by the user) for every/only if all (defined by the user) ROPs which are higher/lower/equal to a certain number (defined by the user) with the average/sum/maximum/minimum of the same ROP in the last N days (defined by the user), for every/only if all (defined by the user) ROPs which are higher/lower/equal to a certain number (defined by the user).
- Example:
Element: ERICSSON MDZRNC02
KPI: Trafico_Voice_Min
Aggregation: RNC
Selected type: AVG Last 8 ROPs > 700 = 838.741
AVG the same ROPs 2 previous days > 500 = 1006.319
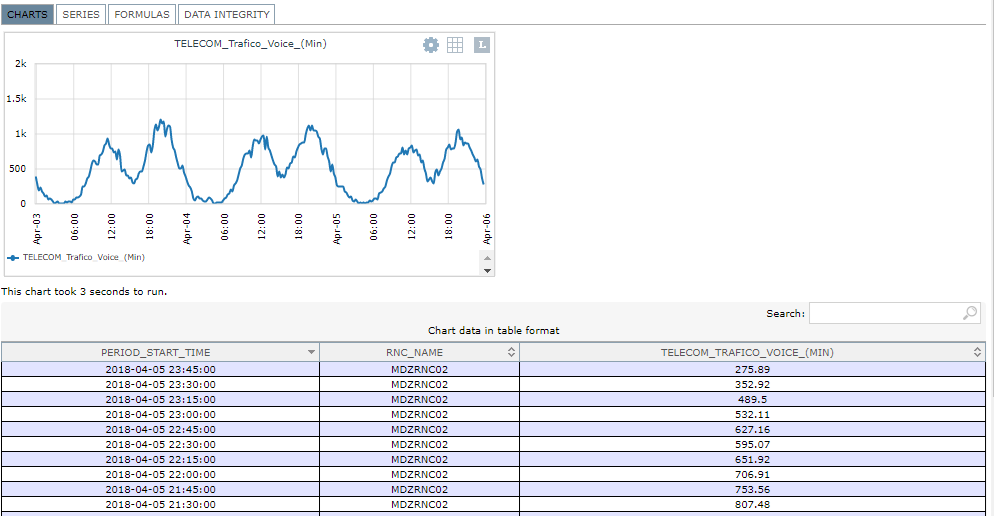
Calculated value: -16,38 % (Minor – according to the set threshold).
When simulating the alarm, the following image is shown:
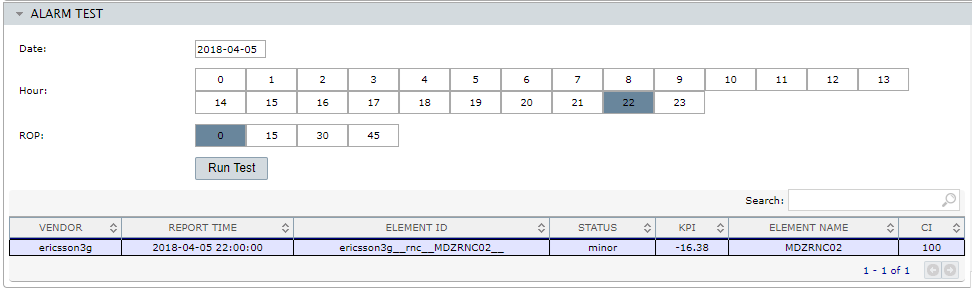
Analyzing the simulated result an e-mail will not be sent. According to the configuration set, this alarm only sends an e-mail when the status is Critical, and, in this case, it shows Minor.
Active Alarms
Select Performance > Alarms > Active Alarms to visualize all active alarms.
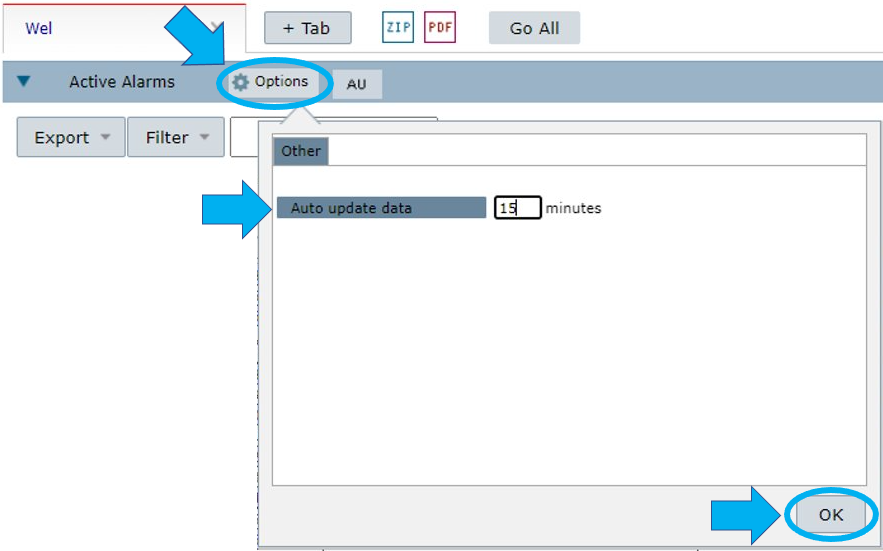
Select the Options menu to define automatic updates. Select OK to confirm.
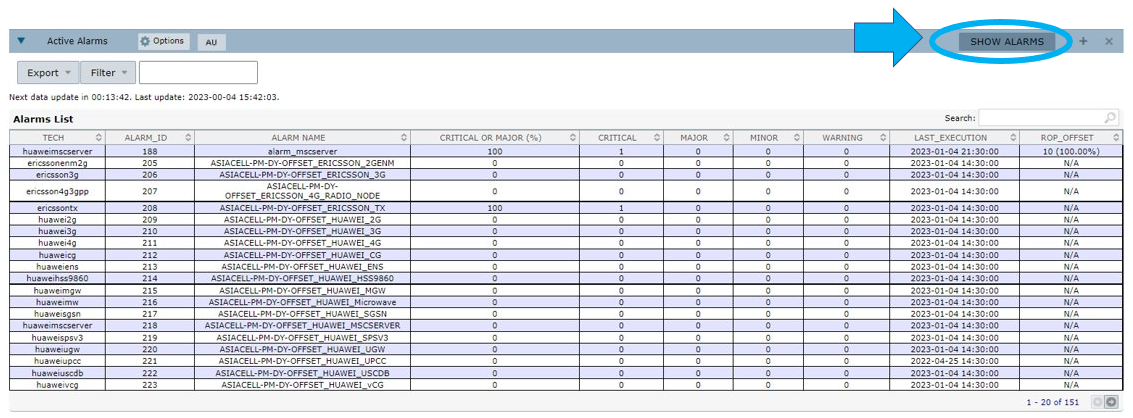
Select SHOW ALARMS to view the existing alarms.
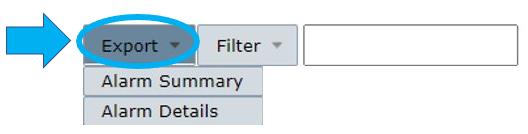
Select Export to export the alarm information.
Select:
- Alarms Summary to export a file with a summary of the alarms.
- Alarm Details to export a file with detailed information about the alarms.
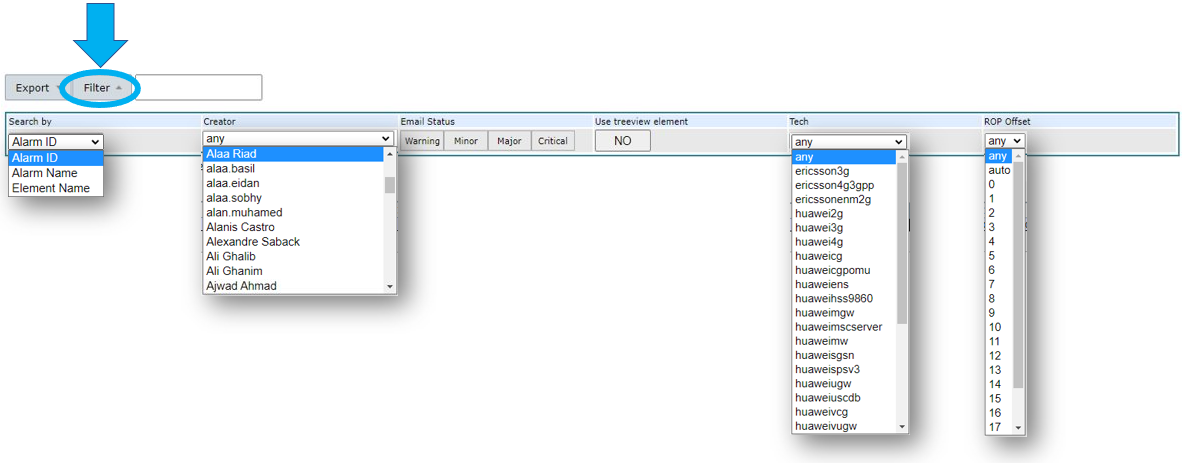
Select Filter to search for alarms. Double-click on:
1 – Search by to filter for alarms by Alarm ID, Alarm Name or Element Name.
2 – Creator to choose from a list of alarm creators.
3 – Email Status to filter for alarms with statuses Warning, Minor, Major or Critical.
4 – Tech to choose from a list of techs available.
5 – ROP Offset to filter the alarms by ROP offset.
There are two ways of searching for active alarms.
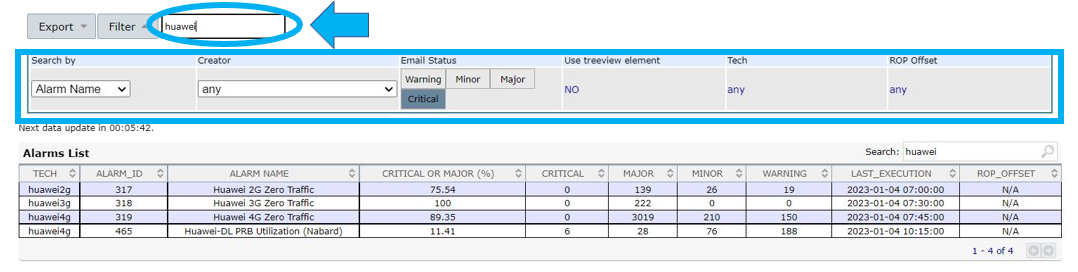
1 – The first option does a more thorough search as you filter for active alarms based on their Name/ID/Element.
Double-click on the filters you want to apply. Choose the filtering options and write the appropriate term in the Search field.
Example: If you want to search for alarms with the name Huawei with a critical status, select Alarm Name in the Search by field and select Critical in the Email Status field. Press Enter on your keyboard to confirm.
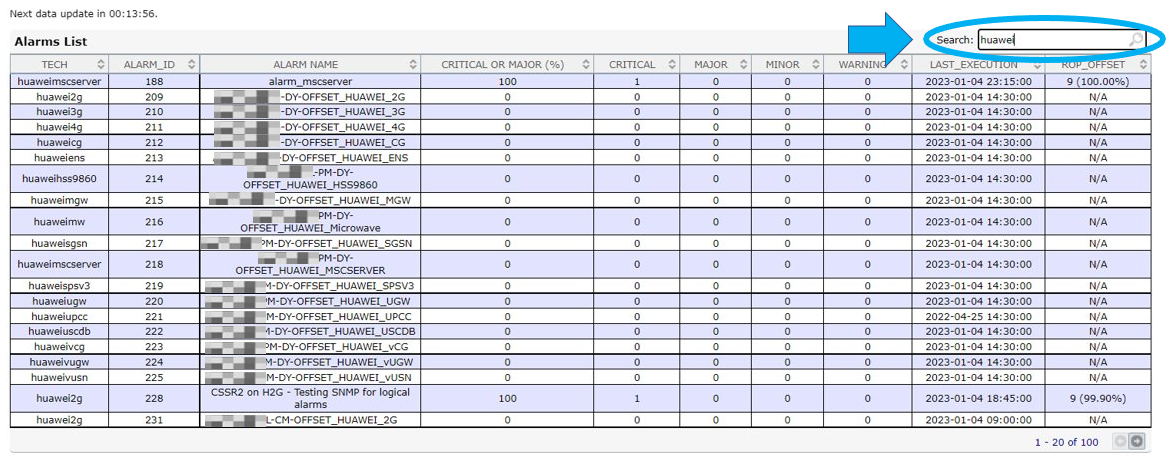
2 – The second option does a more general search.
Write the term you want to search for in the Search field on the right, above the Alarms List table. NetChart will return all the alarms with that occurrence.
Example: If you type the word “huawei” in the Search field, NetChart will return all the alarms that have the word “huawei” in any of the columns in the Alarms List table.
Double–click on an alarm to view information about the alarm’s execution, the status changes and the elements that suffered such changes. Use the Search field to search for specific elements.
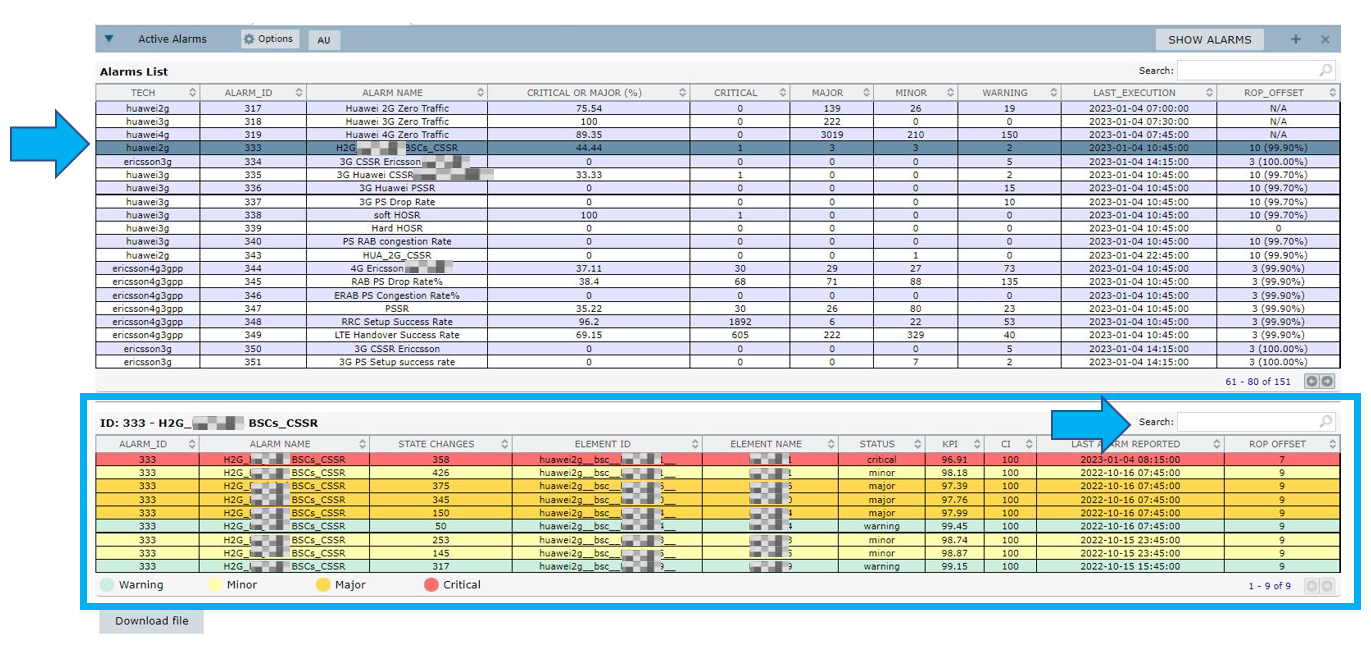
Click on the up and down arrows next to the columns’ names to change the order of the elements.
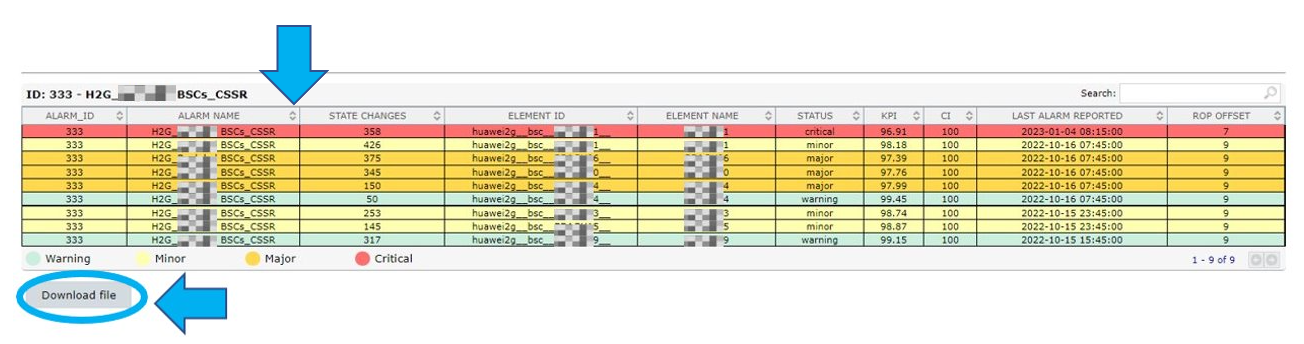
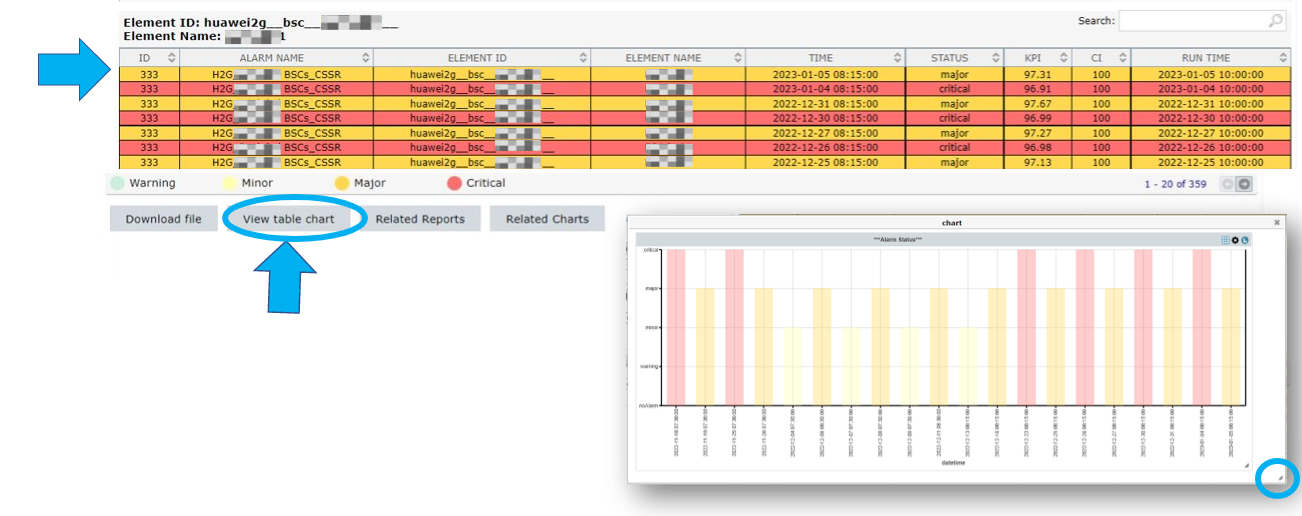
Select Download file to download a table with the elements’ information.
NOTE: The downloaded file contains the same information as seen on the screen, that is ALARM ID, ALARM NAME, STATE CHANGES, ELEMENT ID, ELEMENT NAME, STATUS, KPI, CI (Confidence Indicator), LAST ALARM REPORTED and ROP OFFSET.
Double–click on an element. Select View table chart to view a time data graph about the alarm. This graph shows the changes in criticality status. In the example below, the two first columns show that the alarm has gone from Critical – on 18/11/2022 at 7:30 – to Major – on 19/11/2022 at 7:30.
Use the Expand button to resize the chart.
Alarms’ history
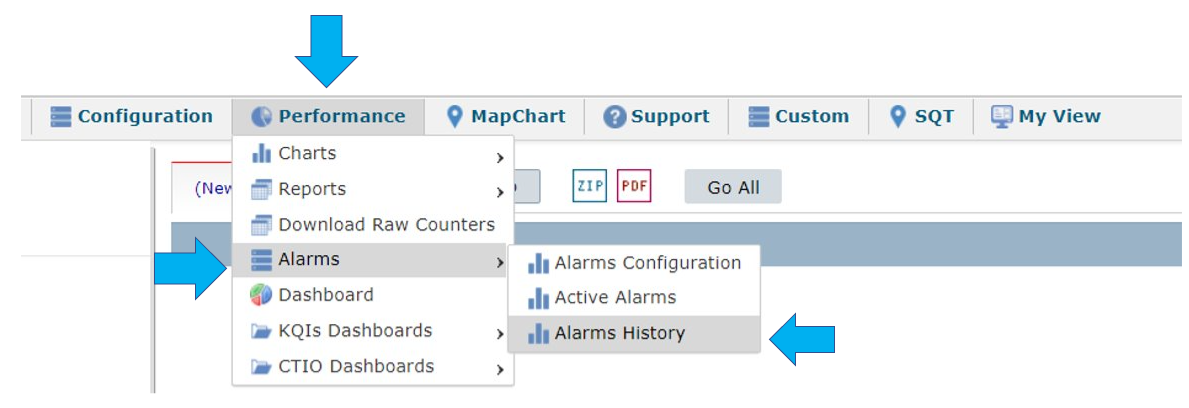
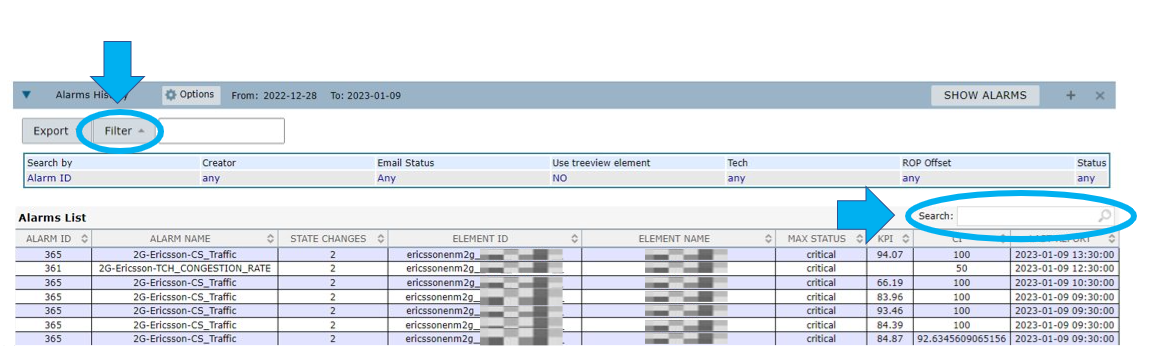
Select Performance > Alarms > Alarms History to analyze the alarm’s history.
Select the Options menu to select the time interval for your consultation.
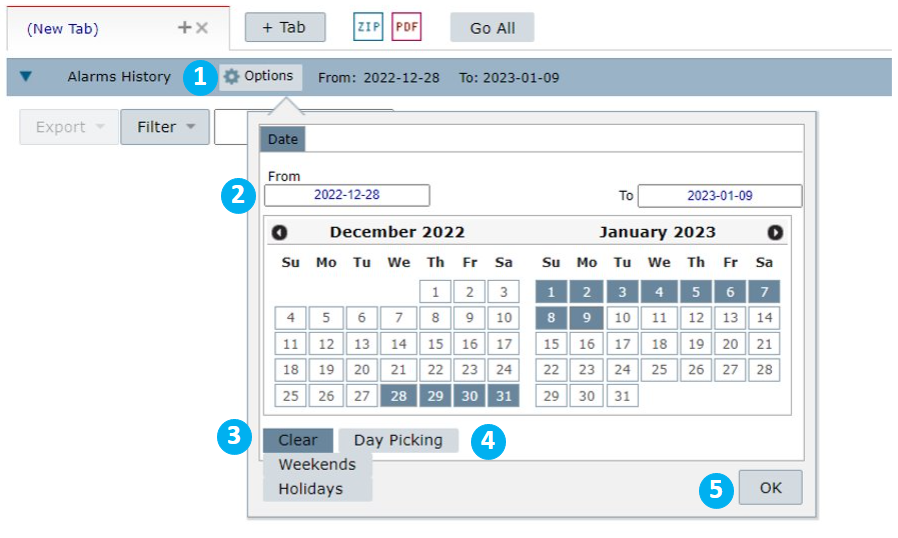
1 – Select Options to view a calendar.
2 – Select the desired days on the calendar by clicking on the first and the last day. The period between them is selected automatically.
You can also write the time interval in the fields From and To.
3 – Select Clear to clear all the dates selected.
Select:
- Clear > Weekends to clear all the weekends in the timeframe selected.
- Clear > Holidays to clear all the holidays in the timeframe selected.
4 – Select Day Picking to manually choose random days.
5 – Select OK to confirm.
Select SHOW ALARMS to view the Alarms List.
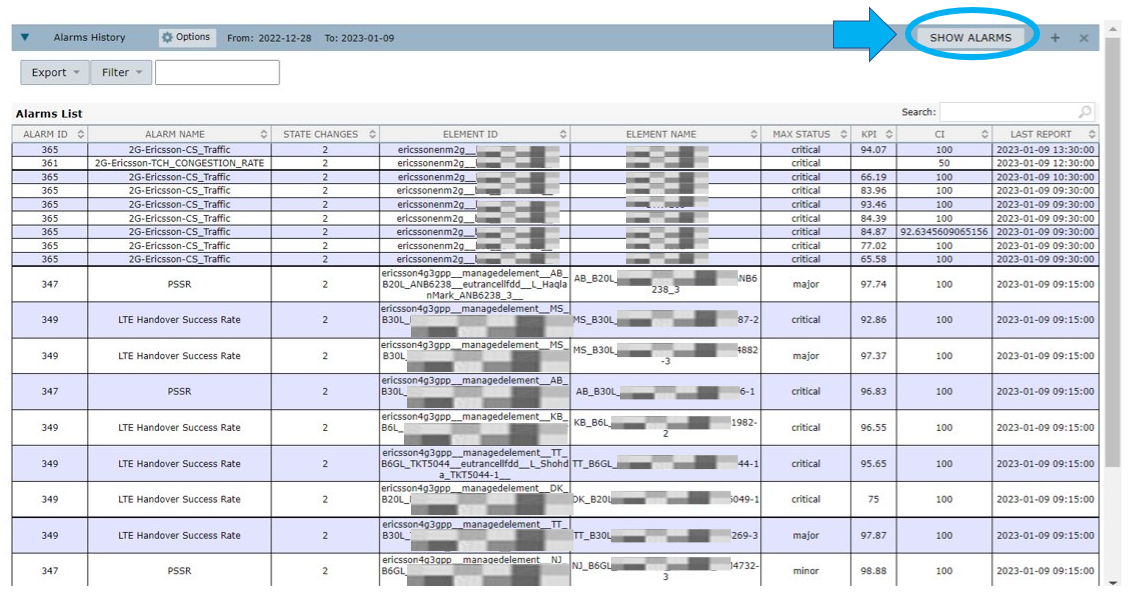
Select Filter to search for alarms. The procedure is the same as the one in the Search for alarms section.
Select Export to export the alarm information.
Select:
- Alarms Summary to export a file with a summary of the alarms.
- Alarms Details to export a file with detailed information about the alarms.

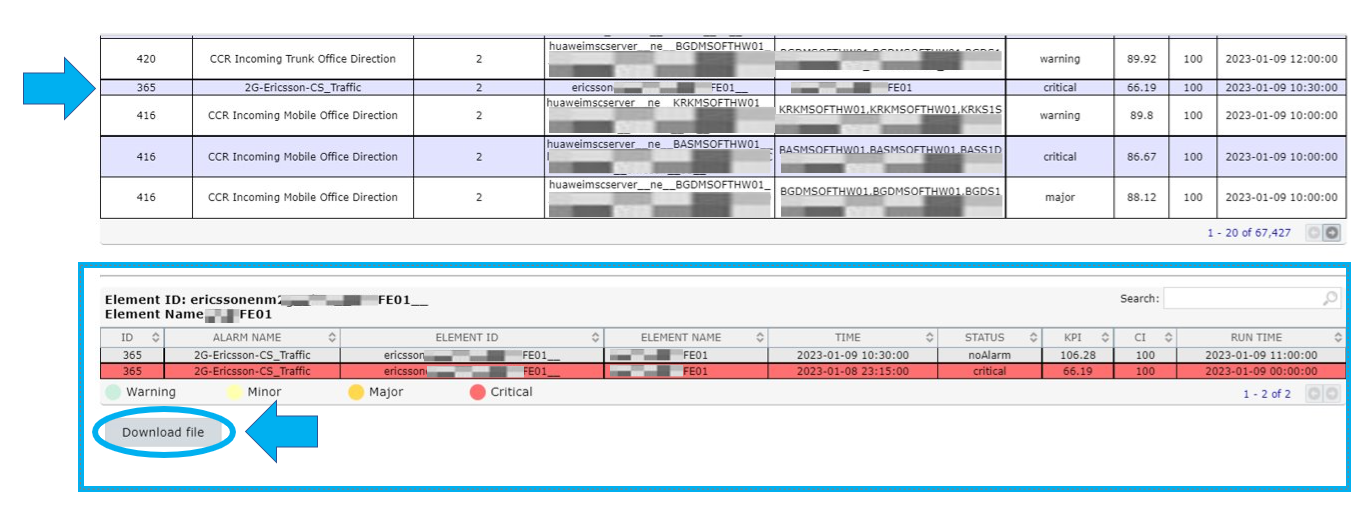
Double-click on an alarm to view the elements present in the alarm.
Select Download file to download the alarm’s history table.
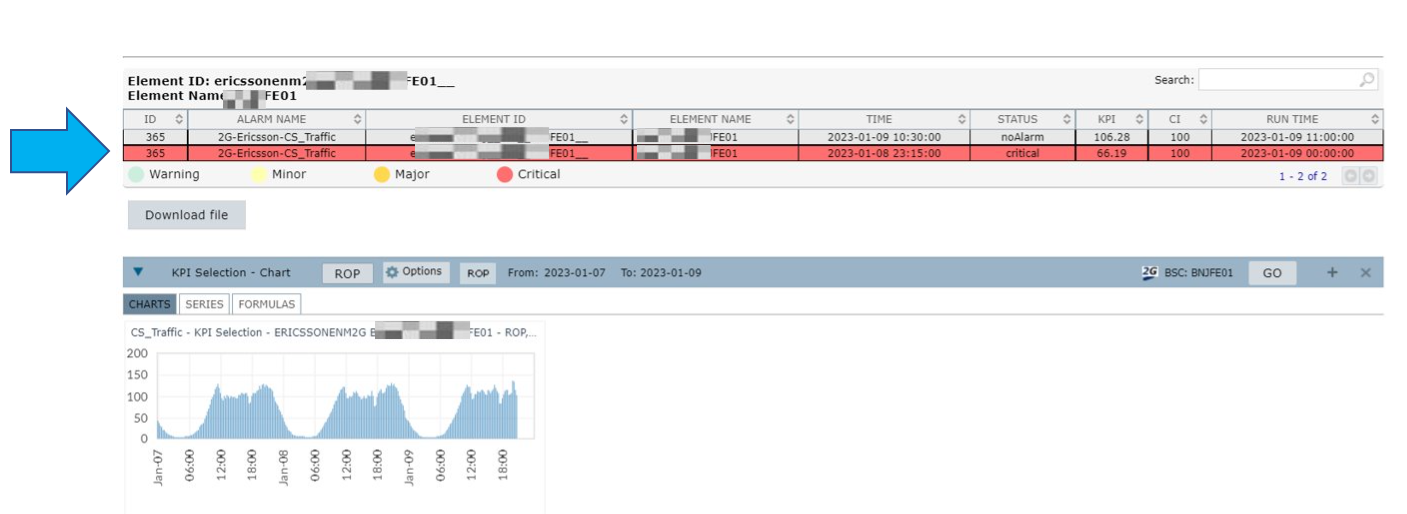
Double–click on an element to view a graph with the KPI and element set for the alarm.
Use cases
Create a missing data alarm
Create alarms to identify when NetChart hasn’t received all the data expected for a given period.
Select Performance > Alarms > Alarms Configuration.

Adjusting the Alarm Configuration
Select NEW to create a new alarm:
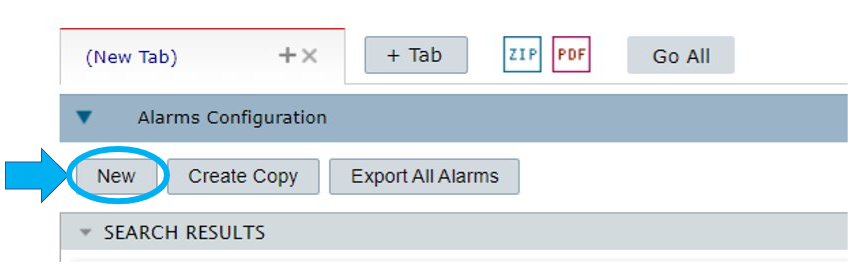
Write a name for the alarm in the Alarm Name field. Set the Alarm Status as ON and then choose a suitable Time aggregation.
In the example below, we defined that the alarm will run every 4 hours in the selected period defined in the field Runs on hours.
In the field Periodicity, we selected Every Day.
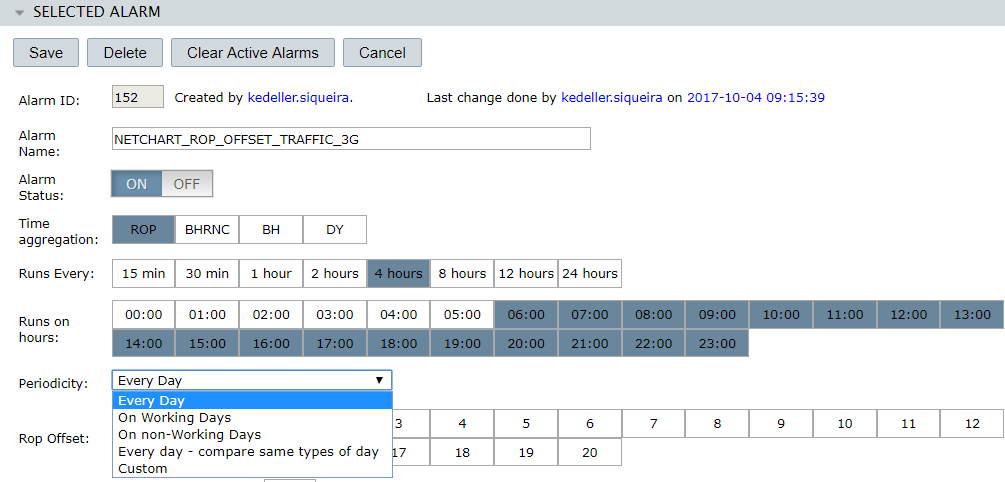
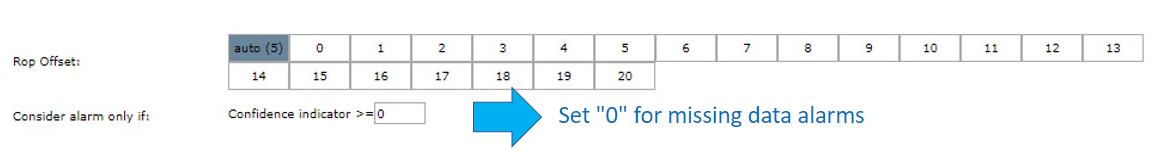
The field ROP Offset is related to the beginning of the measurement period. It means that when “zero” is set, the alarm will monitor the missing data since the last ROP. So, if this alarm is set at 5:03 PM, it will consider the 5:00 p.m.’s ROP.
In the field Consider alarm only if, you can set it as “0” because this field indicates the amount of processed data used to start running the alarm. When it is set as 50%, for example, the alarm only runs if 50% of its data – between the ROP Offset and the threshold – is already processed, impairing its performance.
NOTE: This is only valid for a missing data alarm.
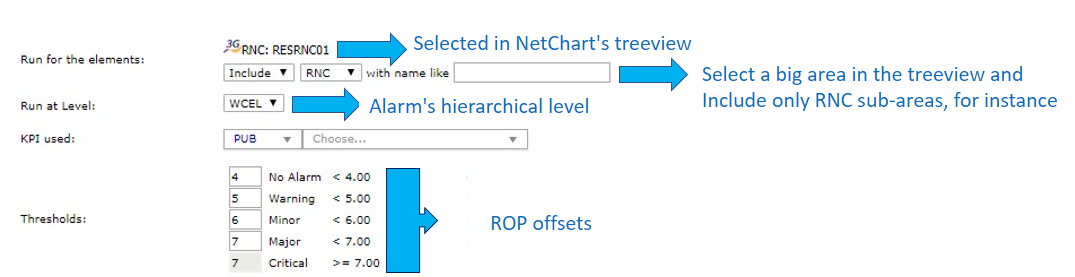
In the field Run for the elements, select which elements will be monitored directly by NetChart’s treeview. Set the hierarchical level understood by the alarm – Controller, site or cell, for example.
Configure the alarm monitored KPI and the ROP Offset boundaries.
The missing data KPI’s formula used in this specific case is:
- MIN(CEIL(TIME_TO_SEC(TIMEDIFF(NOW(), A.PERIOD_START_TIME)) /60/60)) – 2
In which “A.” is the used table alias. So, it is necessary to previously create a KPI in NetChart for the desired vendor, using this formula and specifying the wished table.
TIMEDIFF = calculates a time difference between two intervals: A (NOW) and B (PERIOD_START_TIME). That is: A-B
TIME_TO_SEC = converts the previous result to seconds, then divides by 60 to convert in minutes and repeats the process to convert in hours.
CEIL = rounds up the previous result. For instance: supposing the result is 7500 s, which corresponds to 2,5 hours. This function rounds the result to 3 hours.
MIN = it ensures that the latest element is used in the process.
-2 = it corresponds to the specific time zone of the process, which it is intrinsic to each project and related to Bwtech’s headquarter in Brazil.
In the field Alarm Type, we selected the option 2) Last N ROP values aggregated against thresholds, plus a minimum of 24 last ROPs.
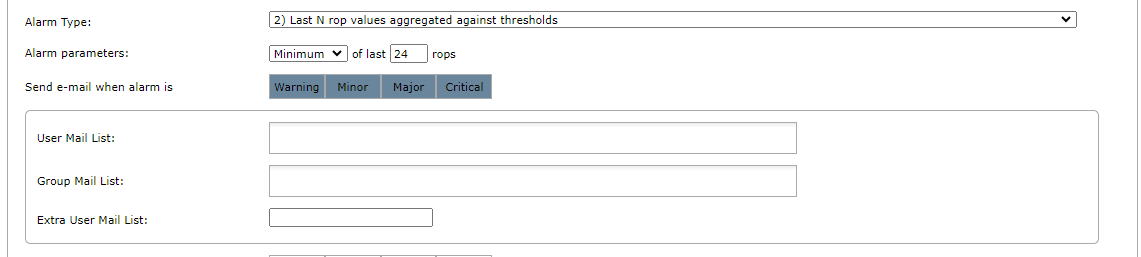
Send an e-mail when a specific threshold is achieved. For instance, in the case above, an e-mail will be sent for all alarm statuses. So, whenever the criticality is over 4 delayed ROPs – as set in the Thresholds item-, an e-mail will be sent to the users inserted in the field User Mail List.
In the field Group Mail List, insert e-mail groups, as well as non-registered users through the field Extra User Mail List.
After all the configurations are done, click on Save on the upper right side of the configuration page and use the tab Alarm Test to test the set alarm.
Select Run Test to set the current date and time so the test is done right away – and, in a few minutes, you will receive an e-mail – containing the set alarms according to its criticality.
NOTE: Confidence Indicator = 100x(SUM(NUM_ROPS)/(MAX(NUM_ROWS_AT_CM)x (NUM_ROPS))
It multiplies by 100 (considering it is a percentage) the total number of ROPS (considering the time duration of 1 ROP as set by the user). Then, it divides this result by the maximum value of the multiplication of the number of lines in the CM table by the total number of considered ROPS (the same as the numerator).
where:
NUM_ROPS = amount of ROPs analyzed in the alarm. It may vary depending on the configuration of each type of alarm. For example, in type 2, the user can choose to analyze the last 4 ROPs. So, in this case, NUM_ROPS = 4.
MAX(NUM_ROWS_AT_CM) = total number of elements in the network. It is calculated based on CM data.
NUM_ROPS = number of lines/elements found by NetChart when executing alarm KPI.
So, consider the situation in which the network of a determined location is going to be under maintenance.
In this condition, it is expected that you set the confidence indicator as 80, for example. So, in this example, the system will only consider this specific alarm when NetChart has 80% of available data and won’t trigger the alarm indicating missing data for the related area. It means, if there is only 10% of available data in the net, the alarm will run normally if it is set in zero.
When it is set in 0 (zero), the system considers any number (different from zero) of available data to run the alarm.
Example:
Consider a region where there are 10 ROPs (result of periods of normally 15 minutes)and 10 elements and suppose NetChart found only 8 elements when running the defined KPI. Then, according to the formula:
100x(SUM(NUM_ROPS)/(MAX(NUM_ROWS_AT_CM)x (NUM_ROPS))
100*(10/(10*8)) = 8%