CNOPERATOR/CMNC Aggregation
OVERVIEW
The CNOPERATOR/CMNC grouping is a NetChart custom aggregation that brings all the PLMN information that is in the vendor network for RAN sharing elements. It is used to generate KPI reports.
This grouping type only works if the user selects KPIs or tables that have the CNOPERATOR/CMNC field in its structure. In cases where this option is not available, the user won’t have this option when generating a report or a chart.
HOW TO USE
The CNOPERATOR/CMNC aggregation is the same as PLMN. Therefore, it can only be used in KPIs or tables that have this grouping option to select.
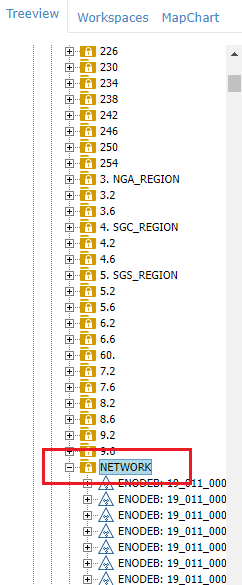
To use it, first, go to the treeview and select a region or an element (for example, the Network folder as shown below).
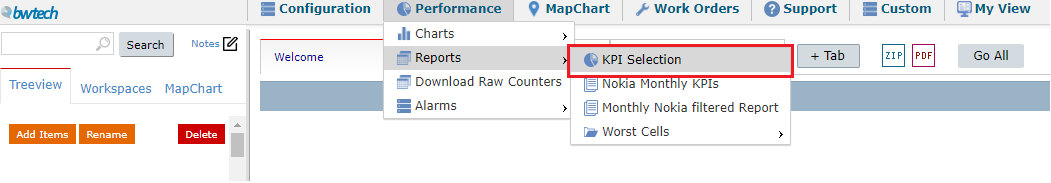
Then, go to the Performance menu, choose Report (or Chart) and click on KPI Selection.
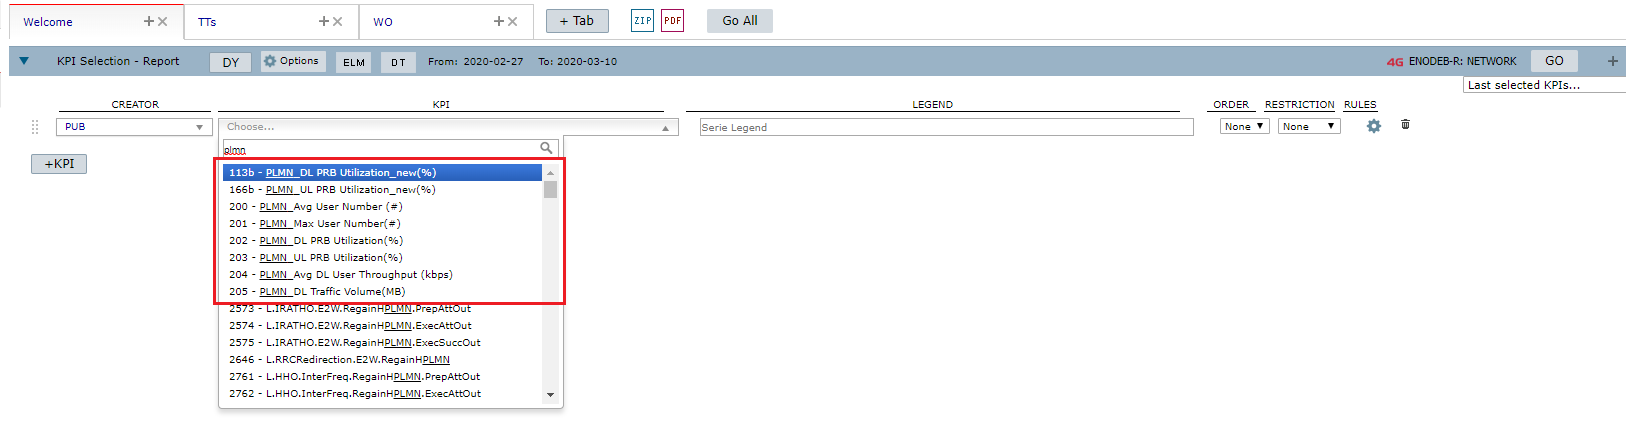
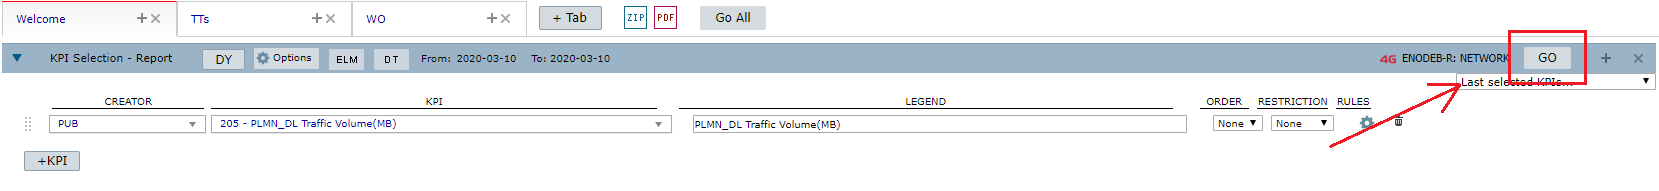
Now it is time to select the KPI. In this case, the CNOPERATOR/CMNC grouping is only available on KPIs or tables that have this field in its structure, so choose one of them.
Click on the Options menu.
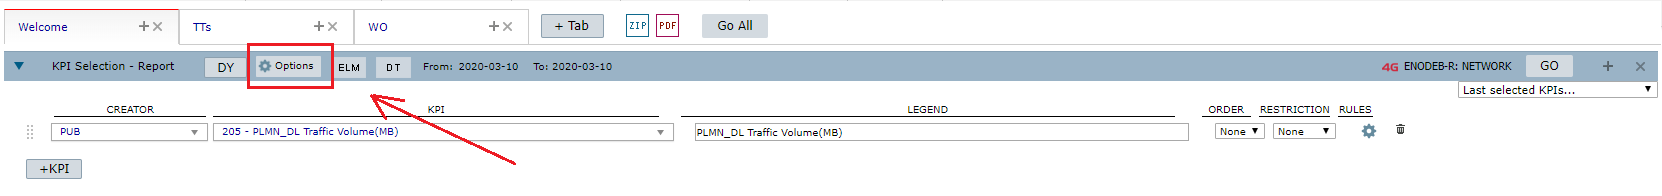
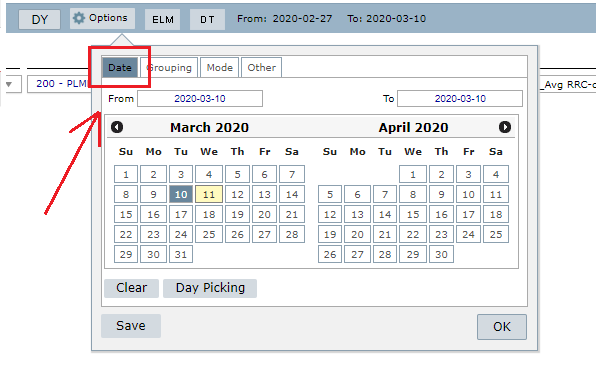
There, select the date.
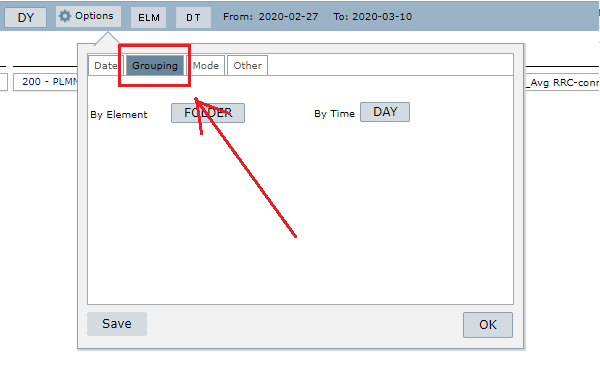
And then click on the Grouping option.
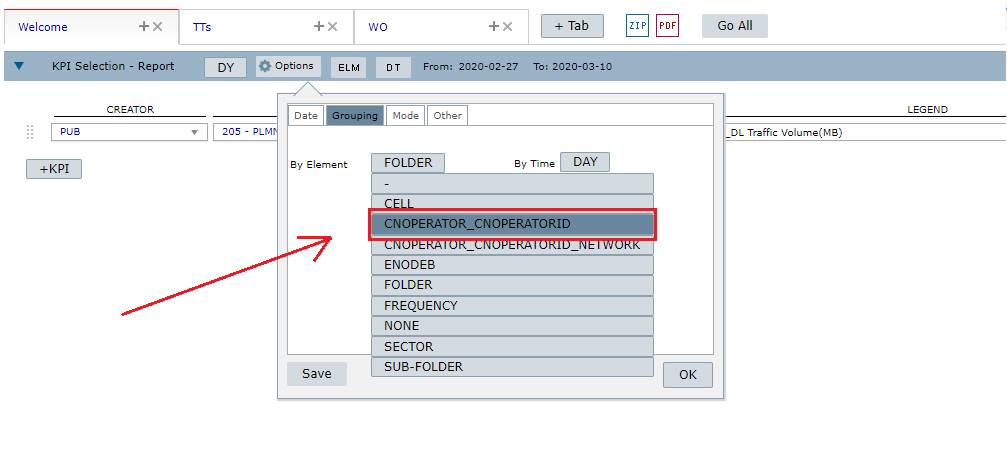
You can choose CNOPERATOR_ID to generate a report on the cell level.
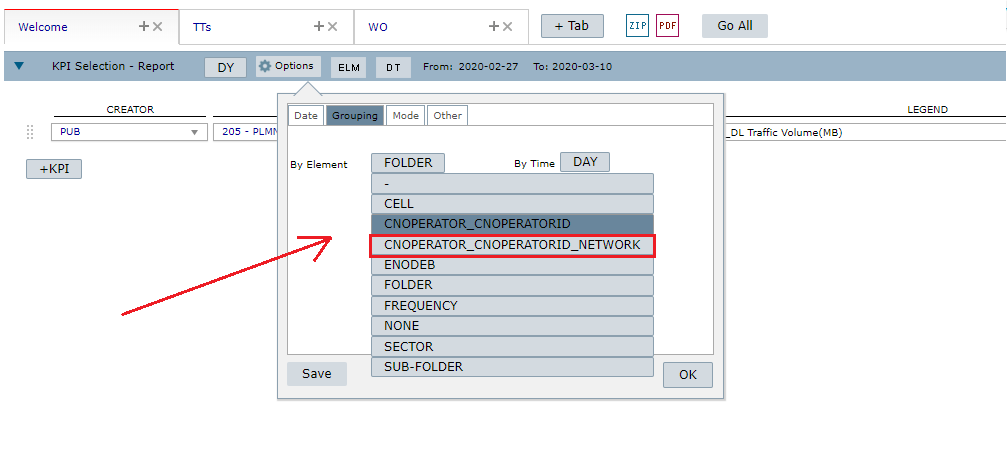
Or CNOPERATORID_NETWORK to generate a report on the region level (example: Região Network).
After selecting the grouping type, click on the Go button.
And that’s it! Your report (or chart) is done!
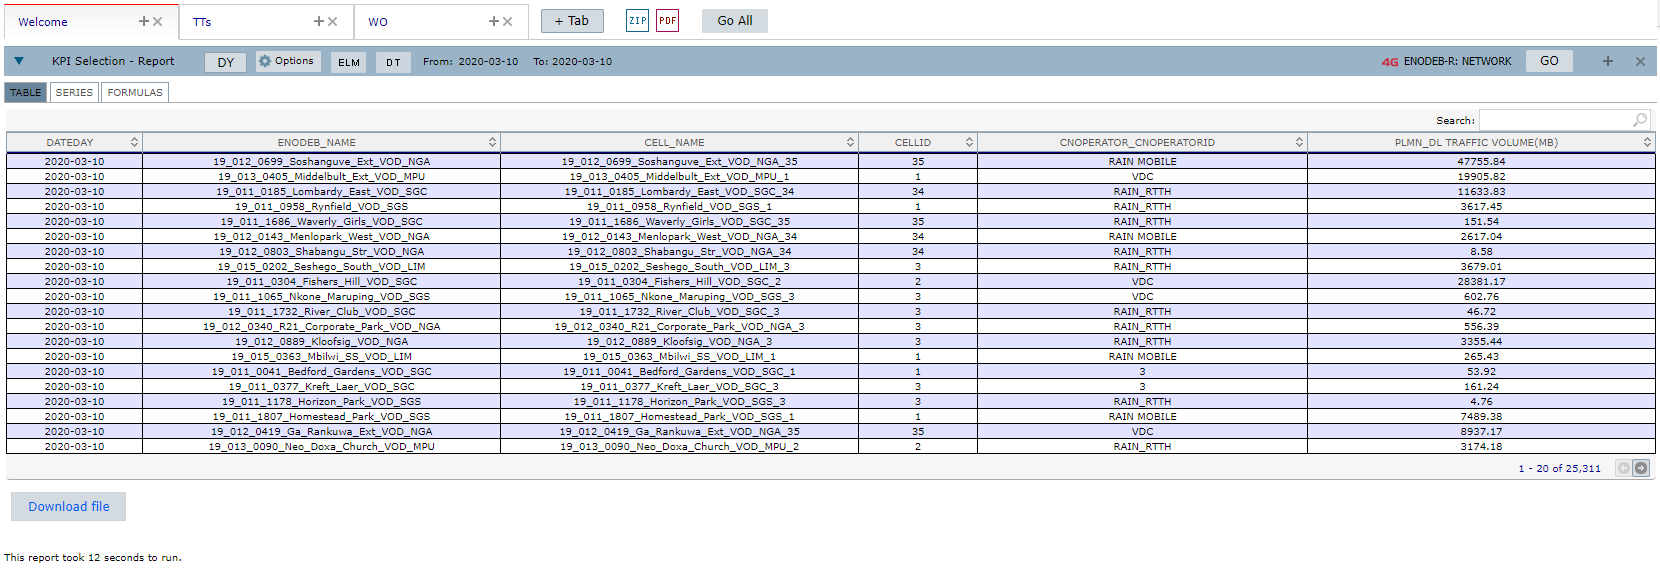 Example of a report using the CNOPERATOR_ID grouping (cell level)
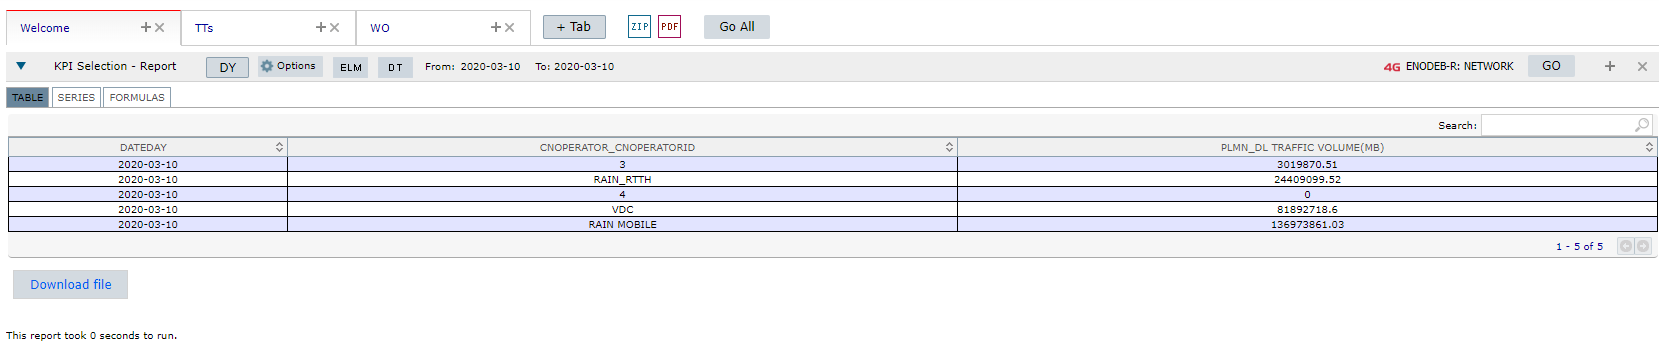 Example of a report using the CNOPERATORID_NETWORK grouping (network level)
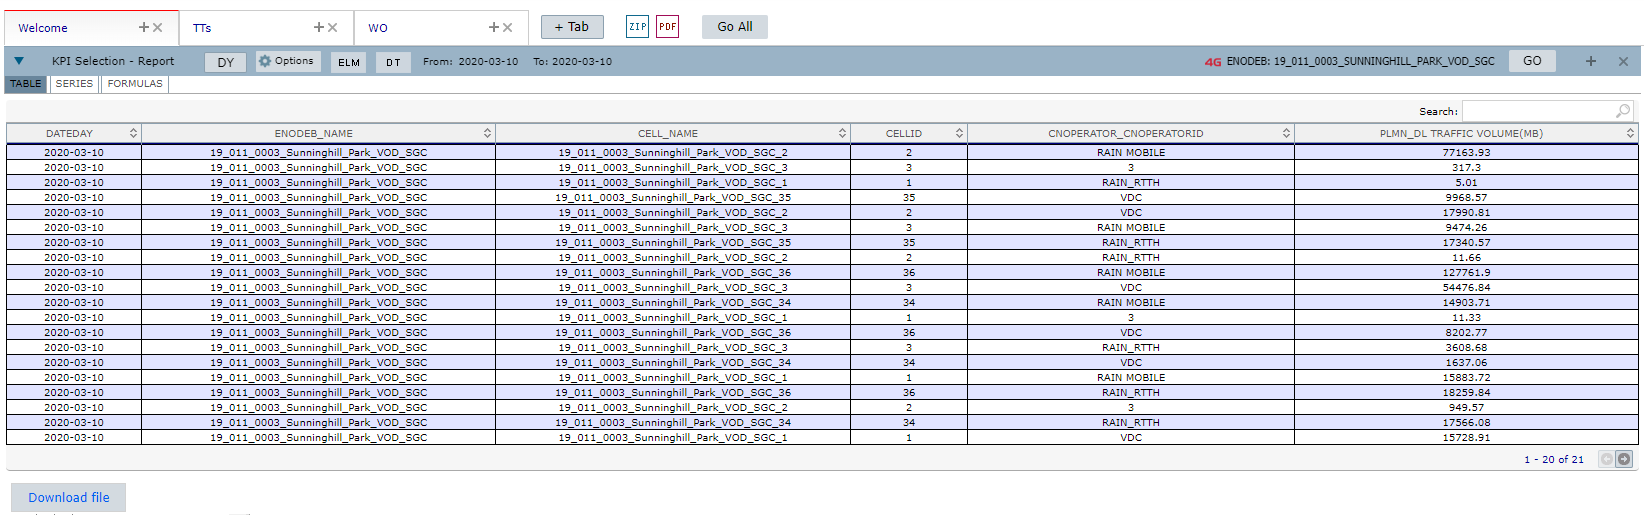
NOTE: You can also create reports, or charts, using this custom aggregation on specific elements.
COMMON ERRORS
Choosing a KPI that does not have the CNOPERATOR/CMNC option in the grouping tab. In this case, the CNOPERATORID/CMNC grouping won’t be available.