Contents
MULTIVENDOR
Overview
The Multivendor feature allows the NetChart treeview division by technology, even if they come from different vendors. This makes it possible to run a KPI for all vendors at one time, getting reports not only for those that belong to the same tech, but also for each one individually.
How to use
Log in to your NetChart account.

Multivendor regions
The treeview unified by technology makes it easy and simple to use the Multivendor feature.
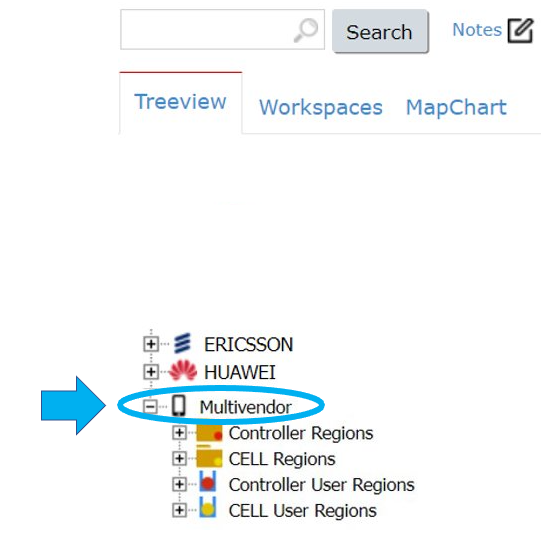
After you log in to NetChart, you can see the Multivendor folder:
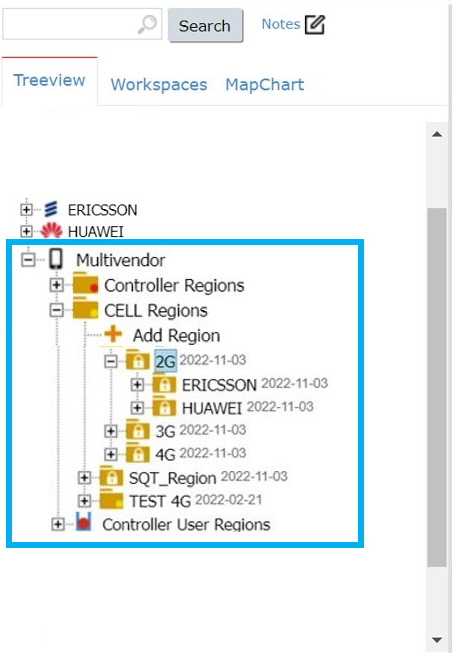
Inside this folder, the network elements are divided by technology, no matter the vendor:
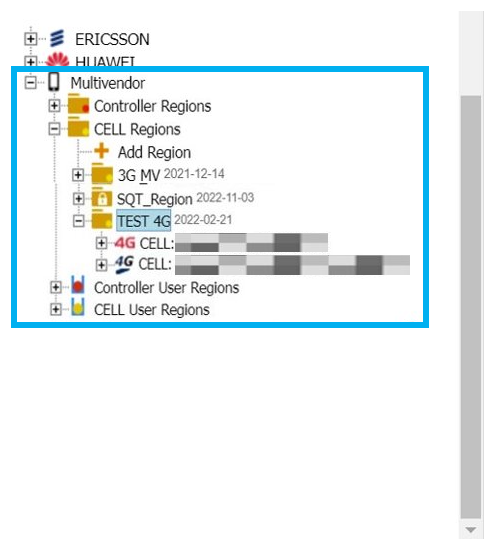
Create specific regions
Create specific regions inside the Multivendor folder to run tests, see how the network elements in a specific neighborhood, city, street, etc. are performing and so on.
Use cases
Create a report or chart for all techs at the same time, or for one specific technology.
Follow the usual steps when using NetChart. To see the step by step, refer to the Charts and Reports Help pages.
The only difference is that you need to select a folder or element inside the Multivendor folder and use a KPI that is available in all the techs and vendors that are in the folder selected.
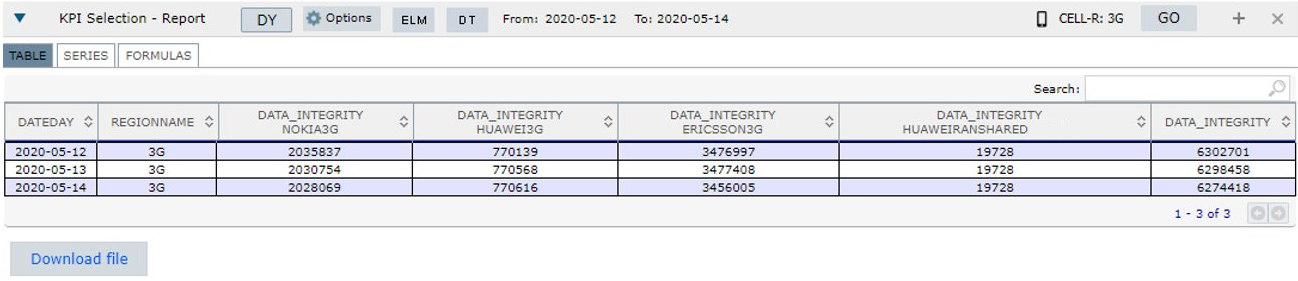
When running a report for all the techs at the same time, the result is a table with one column for each tech and one column with their sum:
Functions descriptions
See the features available in NetChart’s Multivendor module.
Plot MV Series
The Plot MV Series is a specific function for running charts in the Multivendor feature. These charts show one separate series for each vendor in the chart created by NetChart.
First, select the folder or region you want to analyze. Choose the desired KPI and include all the data needed: time period, aggregation, etc. Follow the regular step by step to create a chart using NetChart.
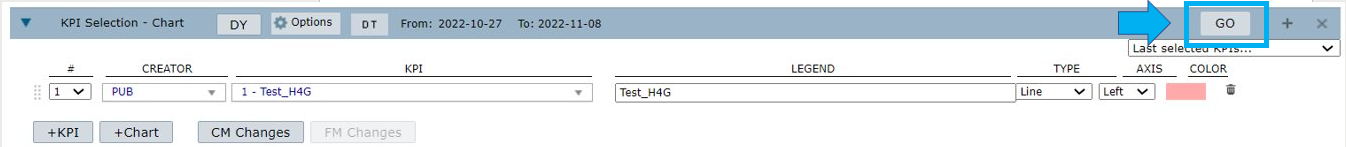
Select Options.
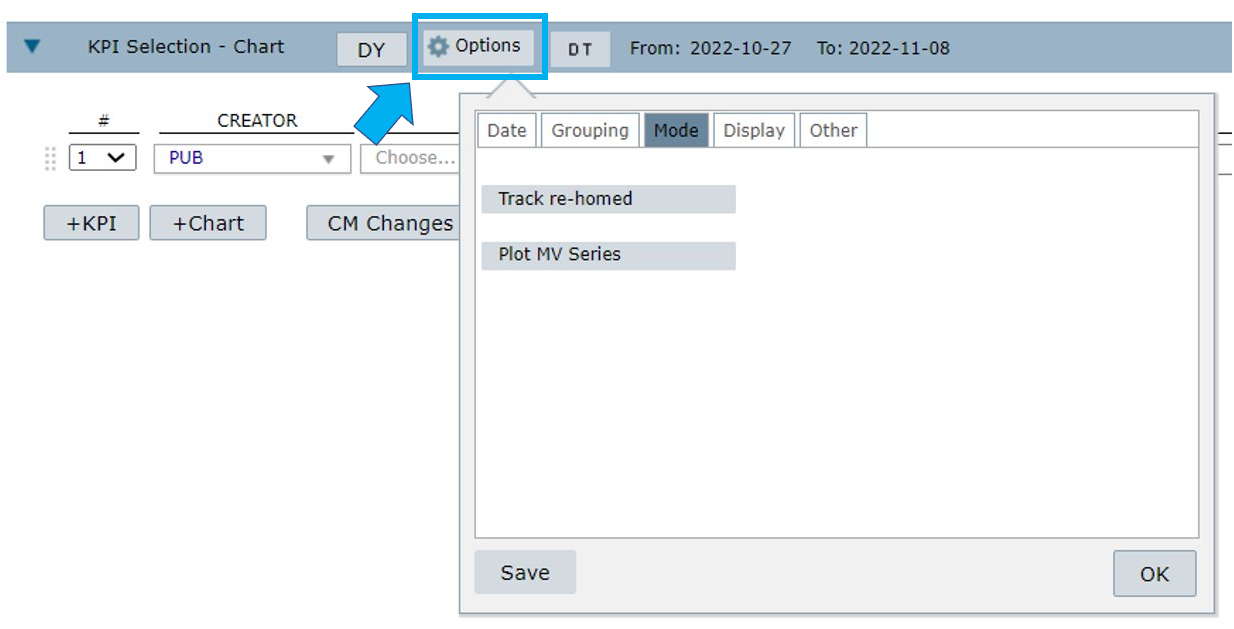
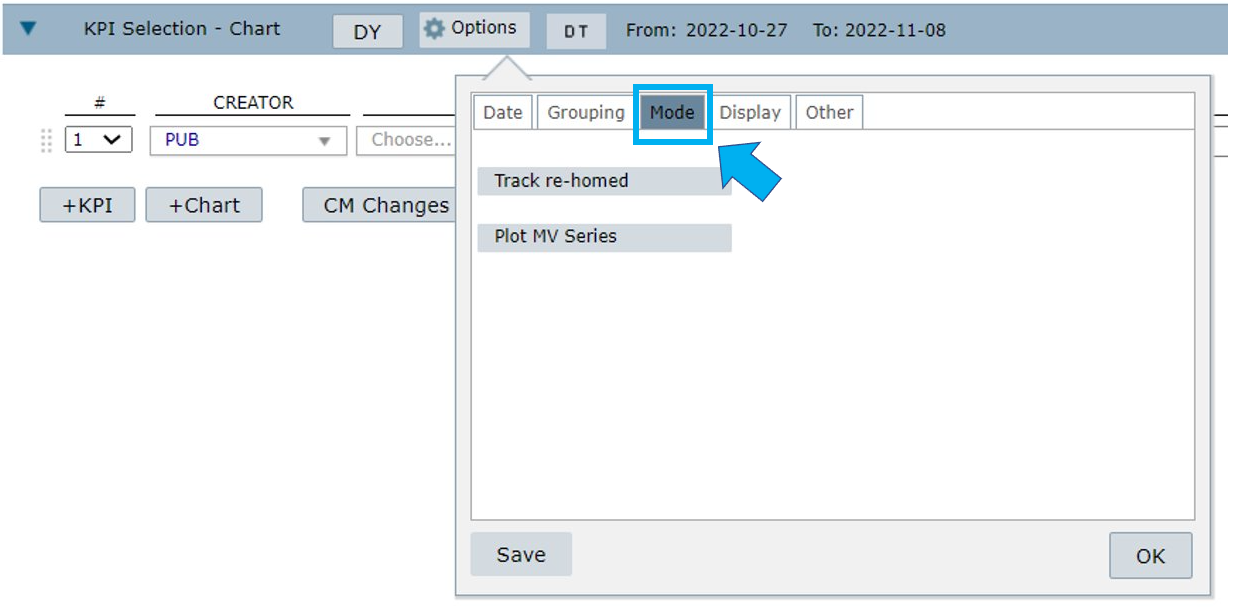
Select the Mode tab.
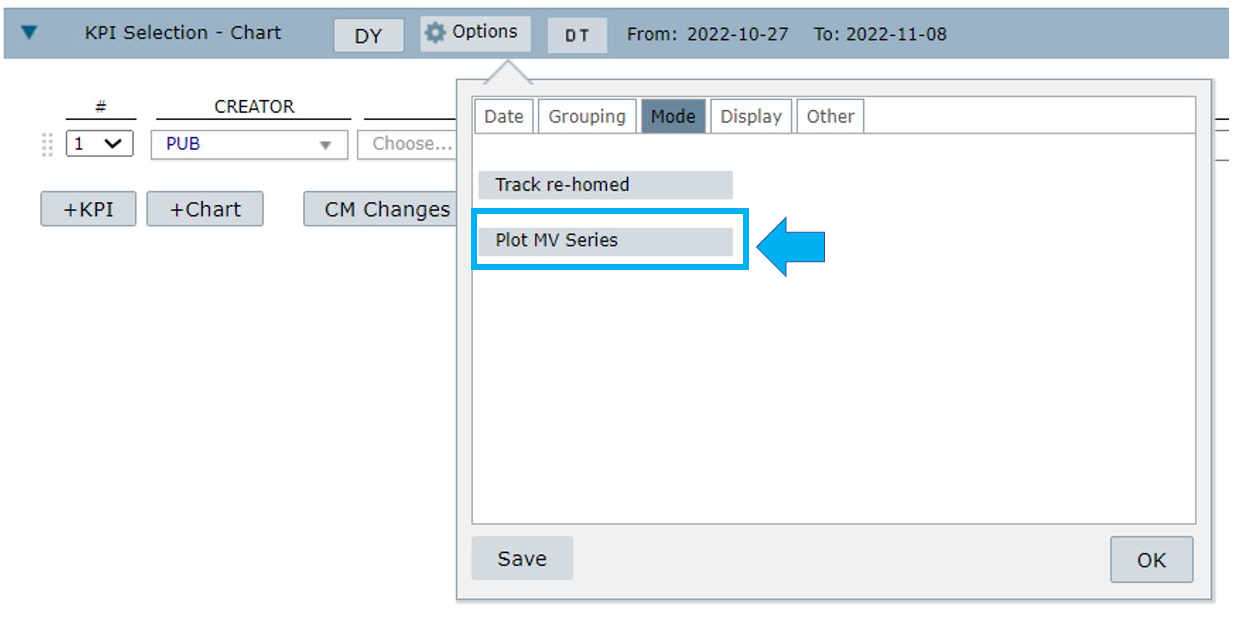
Select Plot MV series.
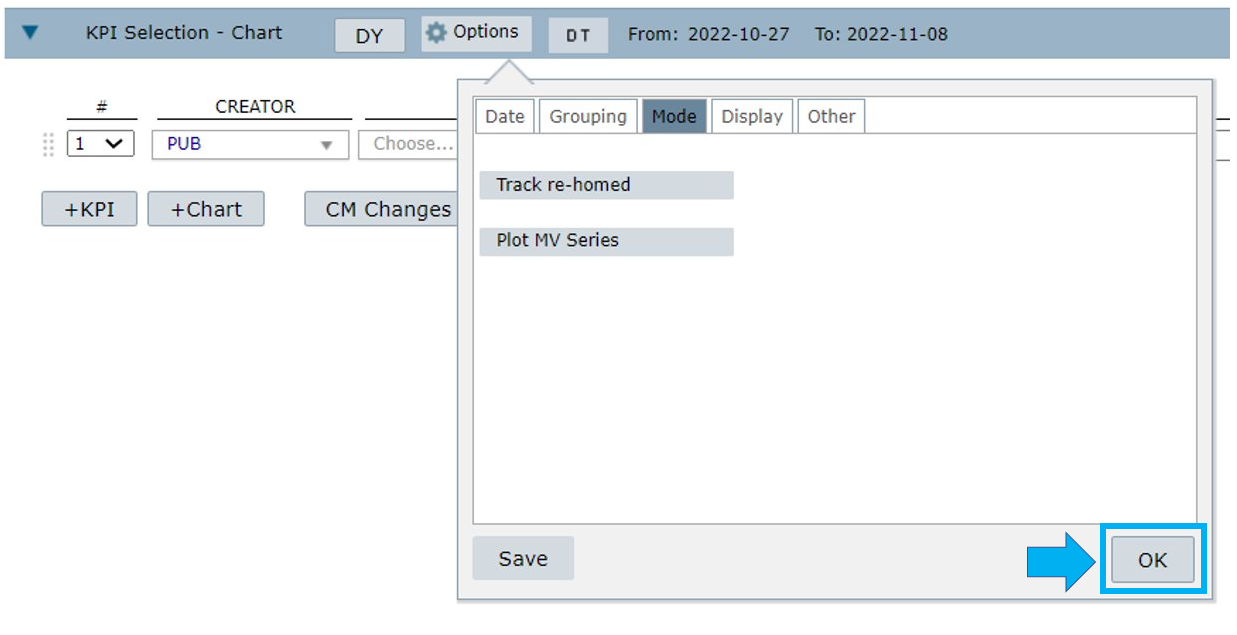
Select OK to confirm.
Select GO to run your chart.
Below, you can see a chart with the Plot MV Series function and one without it.
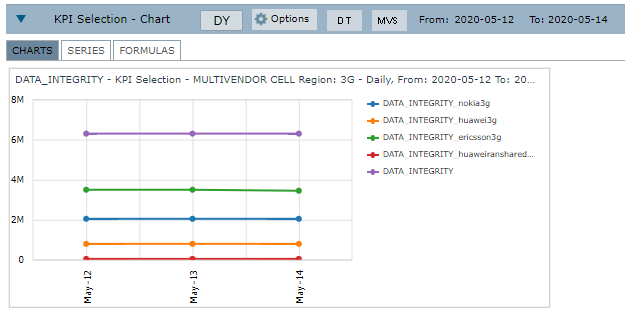
Chart with Plot MV Series function
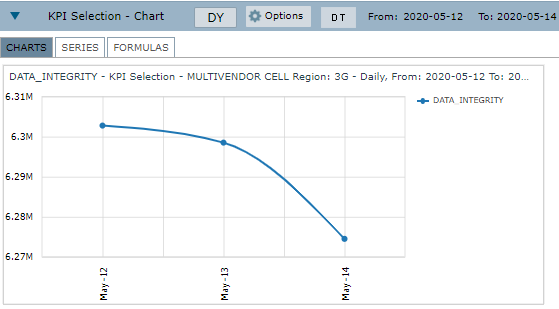
Chart without Plot MV Series function
Formula
There are two types of formula for processing Multivendor KPIs.
NetChart standard formula
Multivendor standard KPIs are the ones that share the same KPI_ID in two or more vendor/tech.
For example, if you want to analyze the availability KPIs for Ericsson and Huawei, you must create both KPIs with the same name for each vendor.
The data sum in Multivendor is not direct, that is, the system does not take each column value and sum it.
First of all, NetChart breaks each KPI from each tech into numerator and denominator. This happens because each vendor has its own formula to calculate the KPI and different ways to show this data.
Then, the system sums all the numerators and all the denominators. Only after that, it makes the division: numerator sum/denominator sum. This is the formula that gives the final value of the KPI for the tech.
NetChart customized formula
This feature allows for the creation of a multivendor formula that combines multivendor standard KPIs.
Refer to the Manage KPI Help page to learn how to create a multivendor customized formula.
Common errors
Trying to get a report or create a chart using a KPI that does not exist in all the vendors of the selected tech or that have different names. (Example: In one vendor, the KPI is named “DATA_INTEGRITY” and on the other, the name is “_DATA_INTEGRITY_”).