Contents
OSS MEASUREMENTS
Overview
The OSS (Operation Support System) is responsible, among other things, for collecting statistics from network elements (NE) and storing its configuration information.
The OSS has the following main types of information:
- Performance Management (PM): events and measurements that occurred on the network and are counted by the NE, such as the number of call drops, average transmitted power, number of call attempts, traffic, handover attempts, etc. These measurements are reported periodically per NE. E.g: a cell reports its total number of call attempts every 1 hour.
- Configuration Management (CM): the element parameters which define its configuration such as the cell power, trx frequency, bsc name, etc. Only a snapshot of the current network configuration can be taken.
- Fault Management (FM): the element physical alarms, such as cabinet high temperature, power disconnected, link set unavailable, inoperative FAN, etc. These events are reported as they occur and are stored in the OSS periodically or instantaneously after their occurrence.
- Hardware Management (HM): the element hardware information, or inventory information, such as the number of boards, processors, A1 interfaces configured, etc. which are not present in the CM. Only a snapshot of the current network hardware can be taken.
- License Management (LM): the element license information such as the number of channel elements (CE) available, the maximum number of erlangs available, iub throughput, the maximum number of HSDPA users, etc. which are not present in the CM. Only a snapshot of the current network licenses can be taken.
The information collected is usually stored in files from different formats such as binary, XML, MML, etc. in OSS folders default from the system or defined by the OSS administrator.
Measurement collection by NetChart
Some or all measurements can be configured for download by NetChart. The system downloads them periodically from the OSS: every 15 minutes, every hour or every day, depending on the configuration. If a direct connection to the OSS through a VPN, for example, is not available, data is updated only once a day.
In the image below, view the step of downloading data from the OSS illustrated between the second and the third block. This process is automatically controlled by a program that sends warning emails in case of errors such as:
- The element hasn’t reported measurements for more than 2 hours.
- The element hasn’t reported the complete 24 hours in a day.
- The connection has been lost with the OSS and 5 connection retries have been done with no success.
The program also automates the download of files, downloading again, the file that was occasionally corrupted.

Measurements collected in the OSS are usually kept in NetChart according to the following table:

This is the default storage designed for NetChart but it can be changed as required. For example, upon request, data can be stored for 90 days for PM – ROP data or 5 years for CM data.
Measurement availability in the OSS and NetChart
The information present in the OSS that can be extracted is available in three ways:
- Reported automatically by the element (e.g: present in folders).
- Queried on the OSS database (e.g: shell scripts or Oracle queries).
- Queried on the element (e.g: MML commands).
To enable NetChart to collect these measurements, two things must be configured:
- The measurement must be activated in the element or programmed to be collected in the OSS.
- NetChart must be configured to collect these measurements.
If the measurement is active in the OSS, but NetChart is not configured to collect it, it will not be present in NetChart’s database. On the other hand, if NetChart is configured to collect the measurement and the OSS doesn’t export it, no information will be stored in NetChart. Therefore functions will return with either empty or no results. To enable measurements reporting in an element, usually for PM measurements, you or the OSS responsible should access the element and enable it. This can be done through vendors’ software such as NetAct for ex-Nokia, Radio Commander for Ericsson and Siemens, or M2000 for Huawei. Below you can see an illustration of one of these systems:

For scripts or MML commands the OSS administrator should program it in the OSS through UNIX crontab or the vendor tools. Contact NetChart’s support team at [email protected] for help with the scripts’ programming.
New OSS versions
When a new OSS version is released, the new version may aggregate new counters and tables that can be measured. It may also remove some unused or deprecated measurements. NetChart database remains backward-compatible across OSS versions and all counters and parameters are available for querying.
When new counters start being reported for the first time, they are not present in NetChart yet. When new tables or counters are present in the imported files. NetChart will do the following:
- Import the known tables and counters into NetChart’s database.
- Include the new tables and counters in a file to be added to the database.
The file with new counters and tables is a script that adds the file to NetChart’s database when executed. Running this script can be a long process which locks the tables being changed and doesn’t allow queries to it. Because of that, this procedure is done manually by NetChart’s support team and while it’s done, users may not be able to use some of NetChart’s features.
Table levels
In the OSS, there are many tables with many different counters, for example:
Traffic table with counters:
- RNC ID
- Site ID
- Cell ID
- TRX ID
- Total voice traffic
- Total R99 traffic
- Maximum PS throughput
- Minimum PS throughput
- Average number of HSDPA users
- Etc.
Cell Availability table with counters:
- RNC ID
- Site ID
- Cell ID
- Average received signal level power
- Maximum transmitted power
- Maximum noise
- Etc.
RNC Processor Load table with counters:
- RNC ID
- Processor Type
- Processor ID
- Minimum Processor Load
- Average Processor Load
- Maximum Processor Load
- Etc.
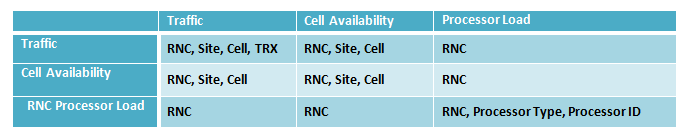
As it can be noticed, there are tables for different elements in the network, from an RNC processor to a cell or TRX. This means that on a cell level table, we can’t get a statistic by TRX. On a TRX level table, we can’t get a statistic by RNC Processor, and so on.
If a KPI uses two tables, one at the cell level, and other at RNC level, for example, the only element that can be selected for that KPI is an RNC – the higher element hierarchically between the two tables. In the given example, we illustrate which element aggregations would be available per table and table combination:
Counter and time aggregations
In the OSS, a minimum reporting period is defined per table. It can range from 15 minutes to 1 day, for example. The counters’ values for this minimum aggregation are defined as ROP (Result Of Period) values, meaning the total, average, minimum or maximum value measured at that period, depending on the counter. Below we give some examples of counters:
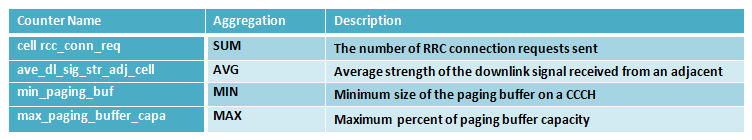
The counter meaning is kept in NetChart no matter which time aggregation is selected, if ROP (minimum aggregation), DY (daily, or 24-hour aggregation) or BH (busy hour). For example, if, in a table, the defined ROP is 15 minutes, the counter ave_dl_sig_str_adj_cell will represent:
- The average download strength in 15 minutes, if ROP aggregation is selected.
- The average download strength in 60 minutes, if BH aggregation is selected.
- The average download strength in 1440 minutes, if DY aggregation is selected.