Contents
END TO END REPORT
OVERVIEW
Aiming to analyze Capacity, Quality or Availability of the net as a whole (TX, CORE and RAN), NetChart brings an innovative solution called End to End Report.
HOW TO USE
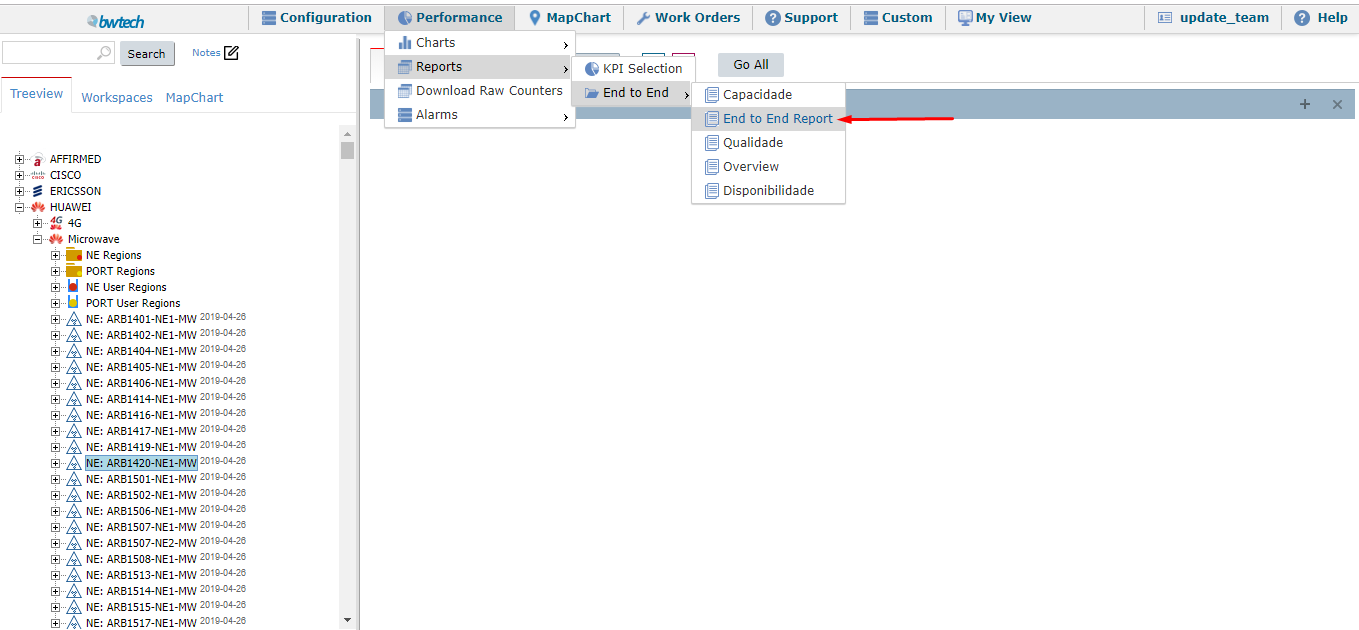
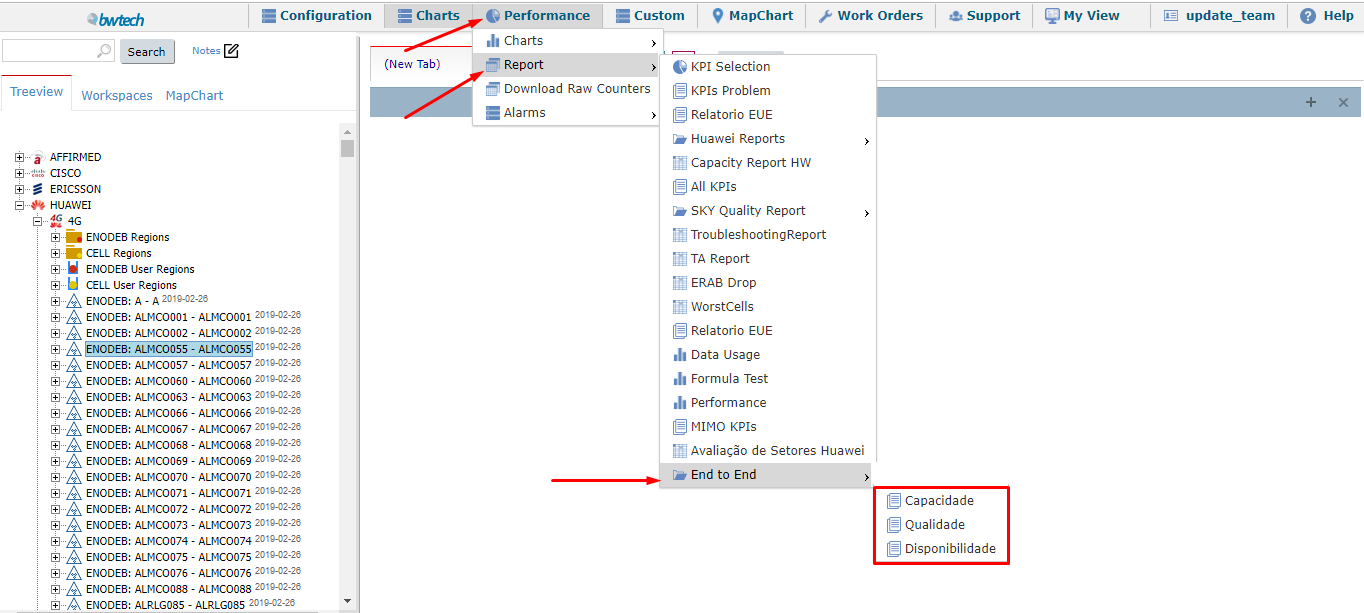
To use it, the user must select an element in the treeview (considering possible to select more than one element), than the Report option on the Performance menu. After, just select the End to End (in this example it is the last option, but it can vary for each costumer’s menu) and click on the desired option of analyses: Capacity, Quality or Availability.
FUNCTIONS DESCRIPTION
Options
As in the KPI Selection, it is required to configure time aggregation as well (DY, DY2122, ROP and HOUR), and all the settings in the Options menu: Date, Grouping, Mode and Other.
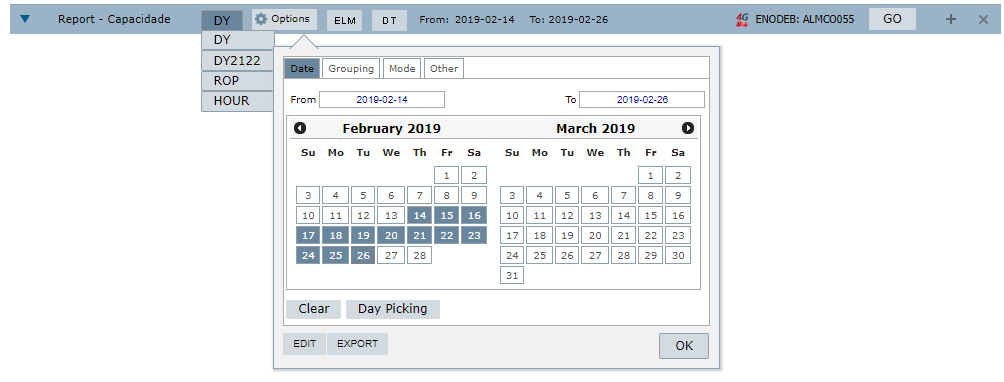
As all topics are already configured, press OK to save all the information and then click on the GO button – which is on the top right corner of the screen.
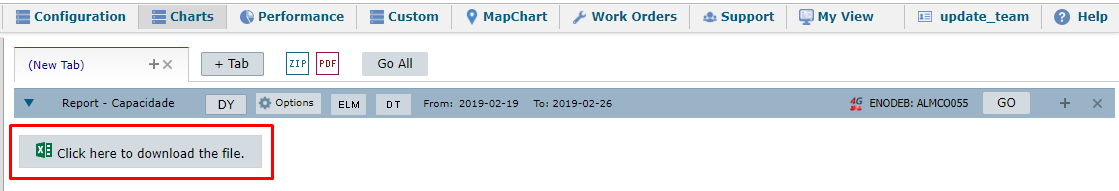
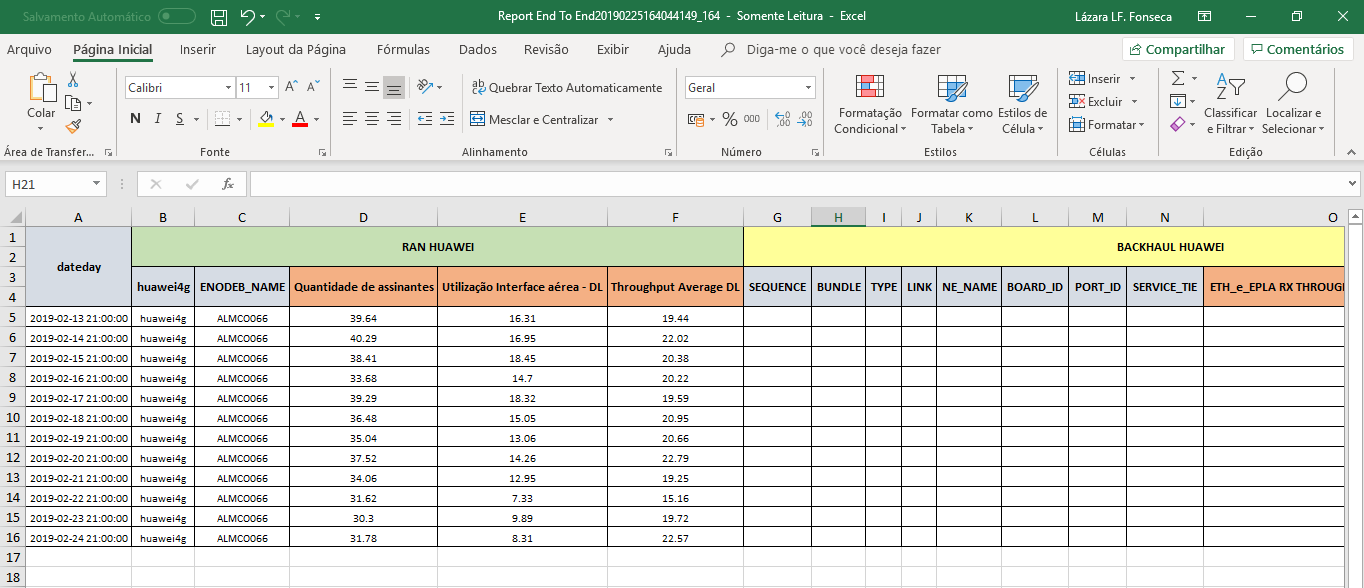
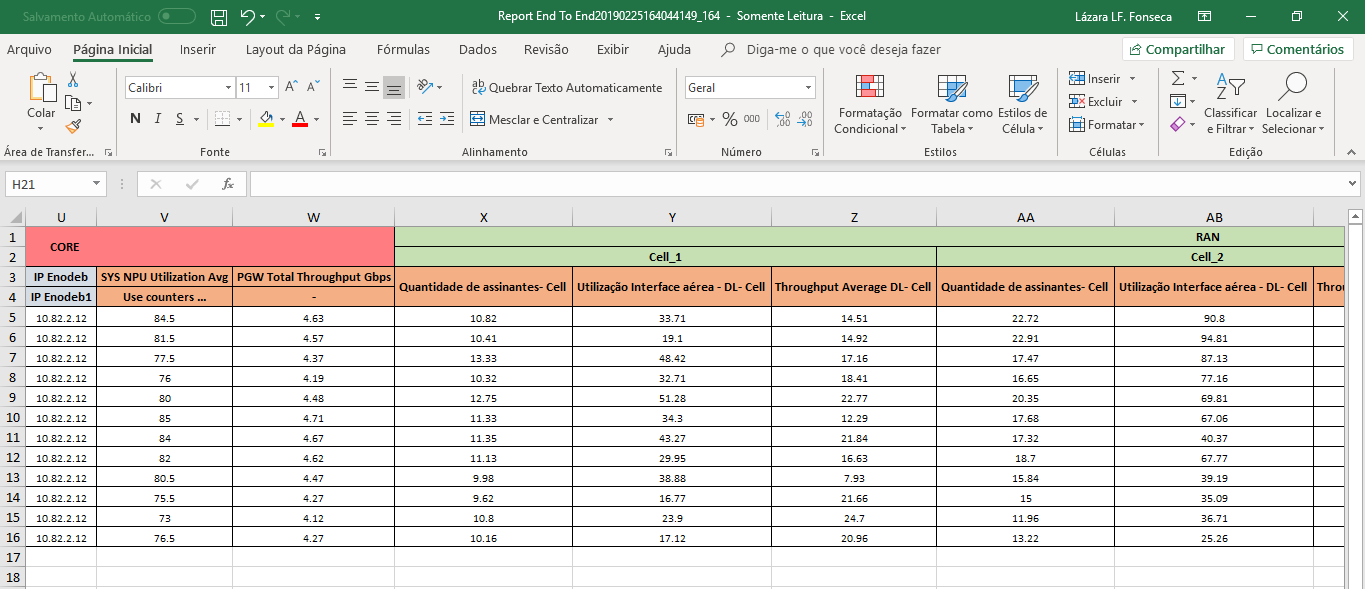
A .xls file in compiled and available to download, as illustrated in the image above. In this example, this file contains all the net’s capacity information related to the element selected on the treeview on the chosen period and it also describes separately TX, RAN and CORE information.
When opening the file, a spreadsheet similar to the next images will be exhibited:
Creating a report
In case the user wants to create its own report, the following steps demonstrate how to do it:
As illustrated in the picture, choose an element in the treeview, select the Custom Menu, click on Manage and choose the option Report.
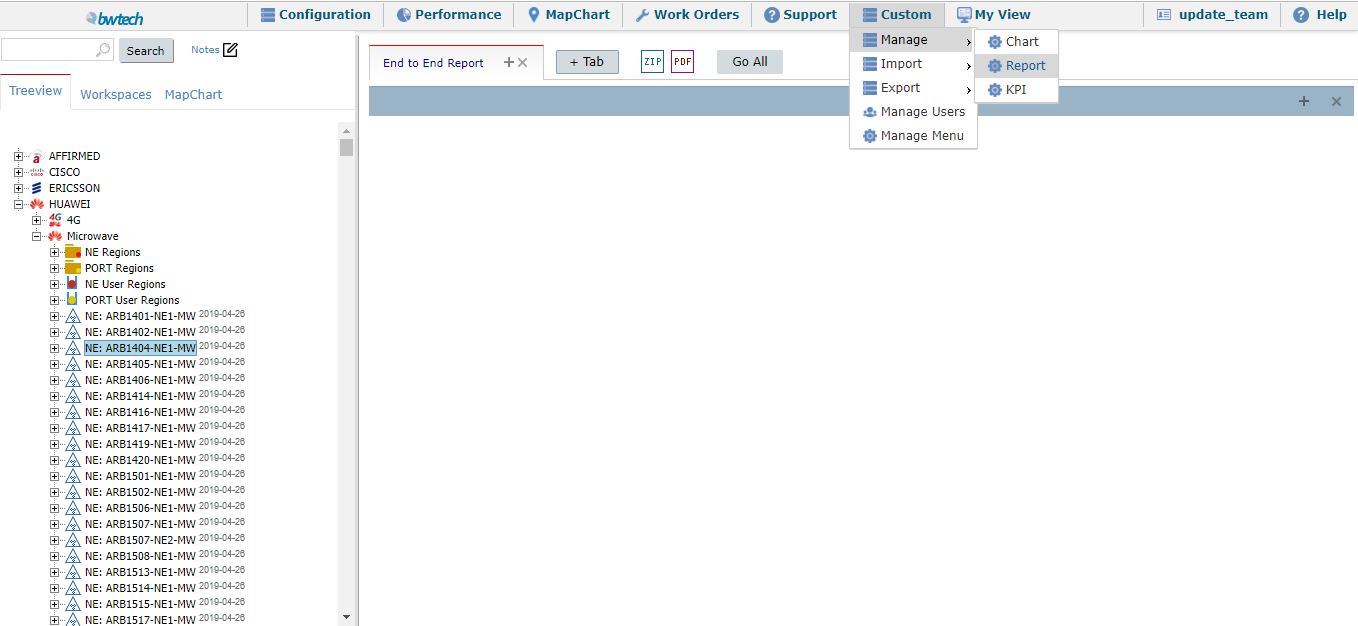
The system will show the screen below:
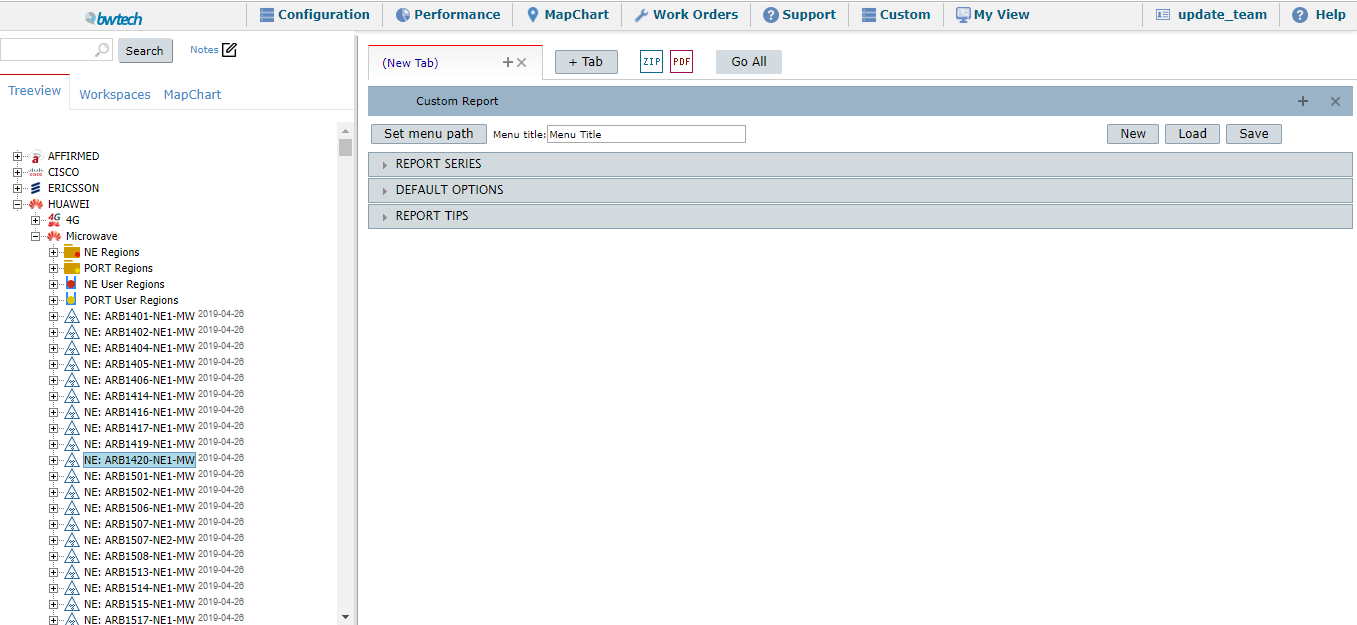
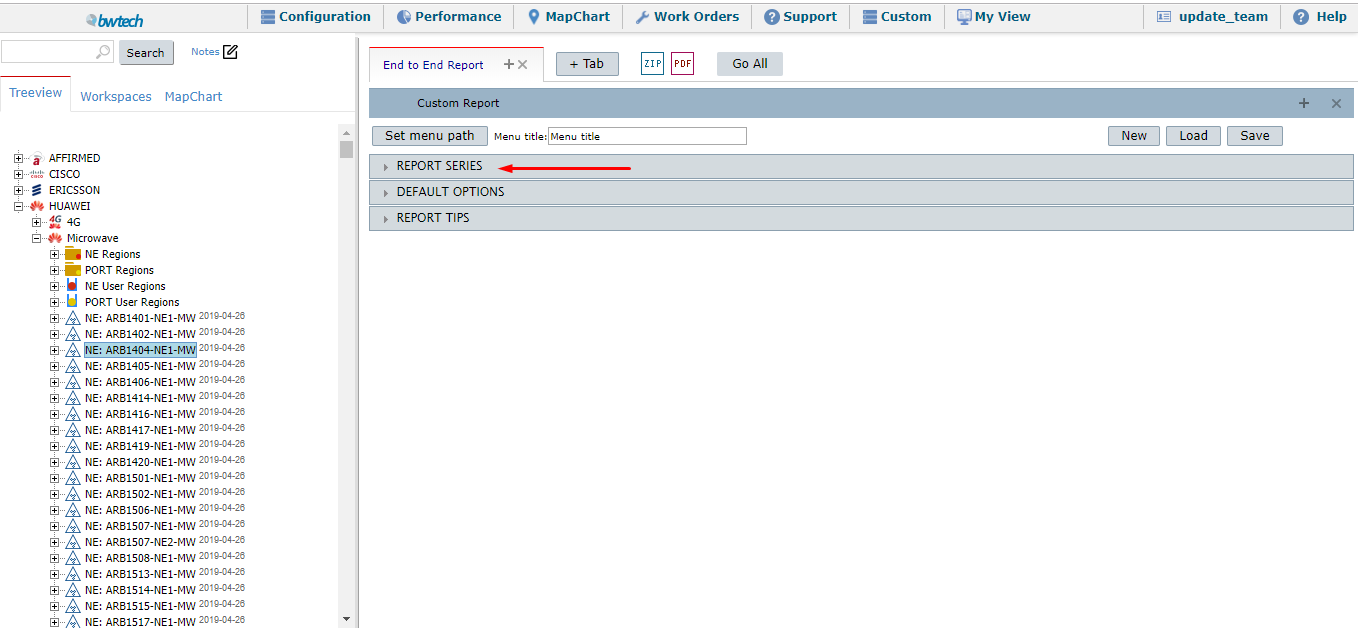
When expanding all the tabs, you will see this:
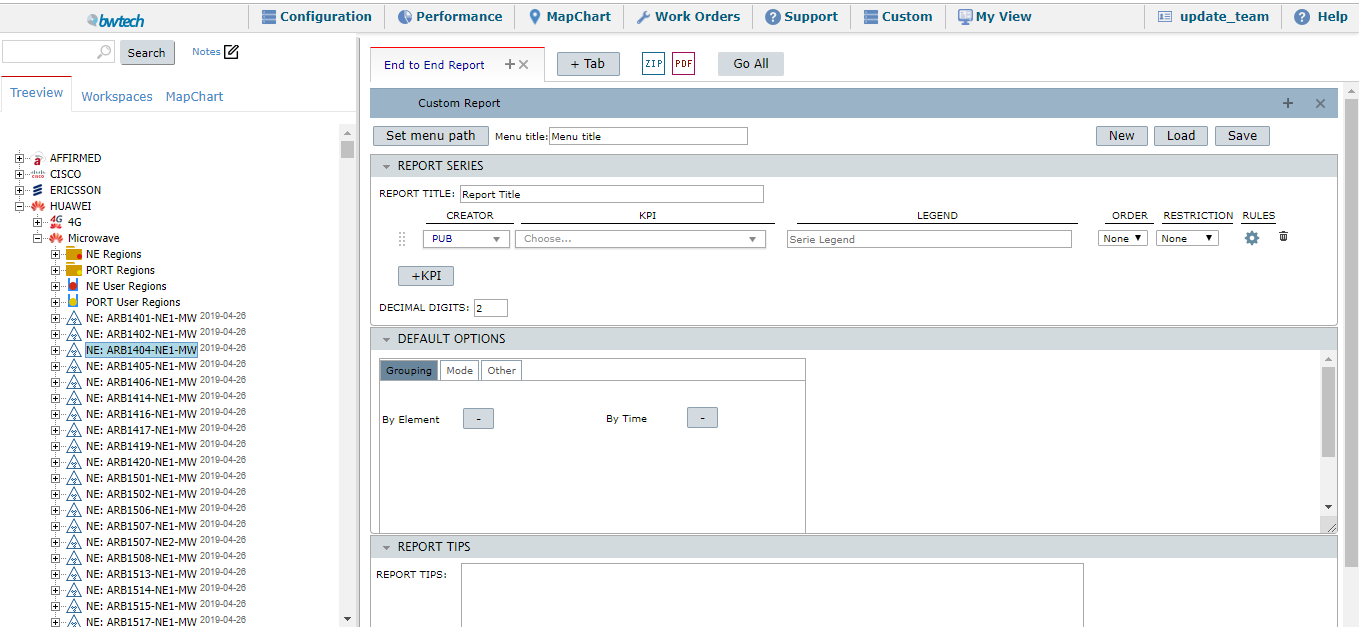
On this page, it is possible to define some details about your End to End Reports, such as grouping by different types of elements or time, add some tips to your report, etc.
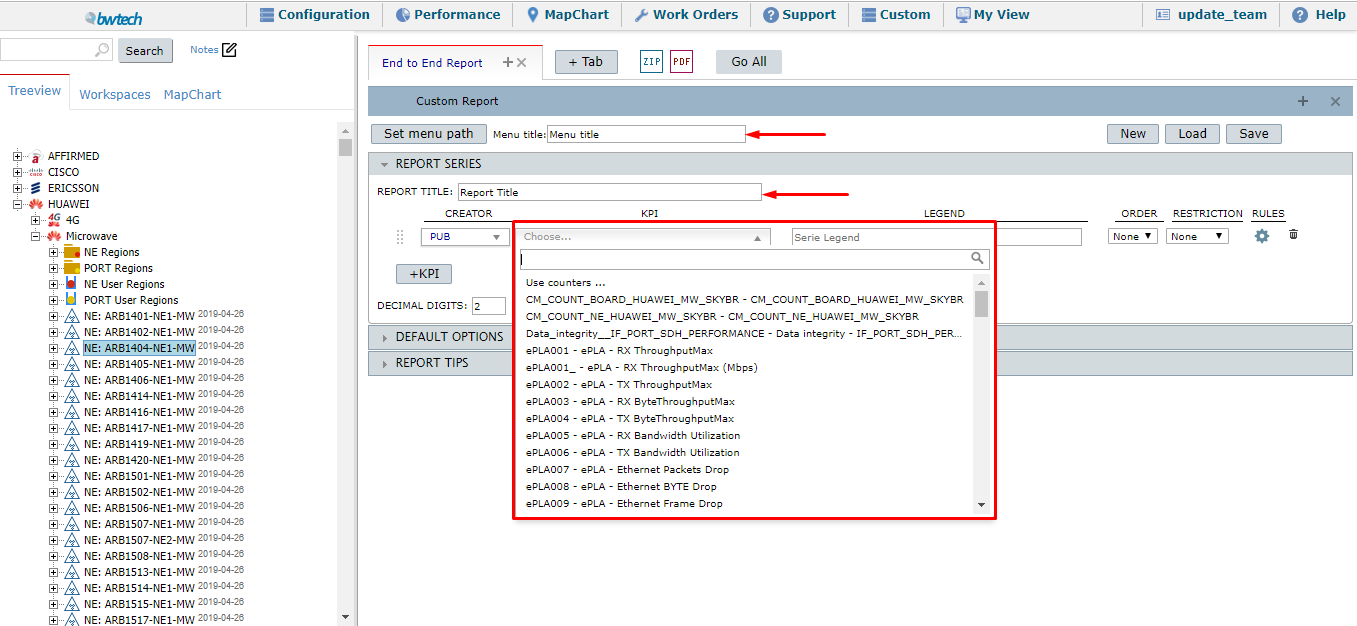
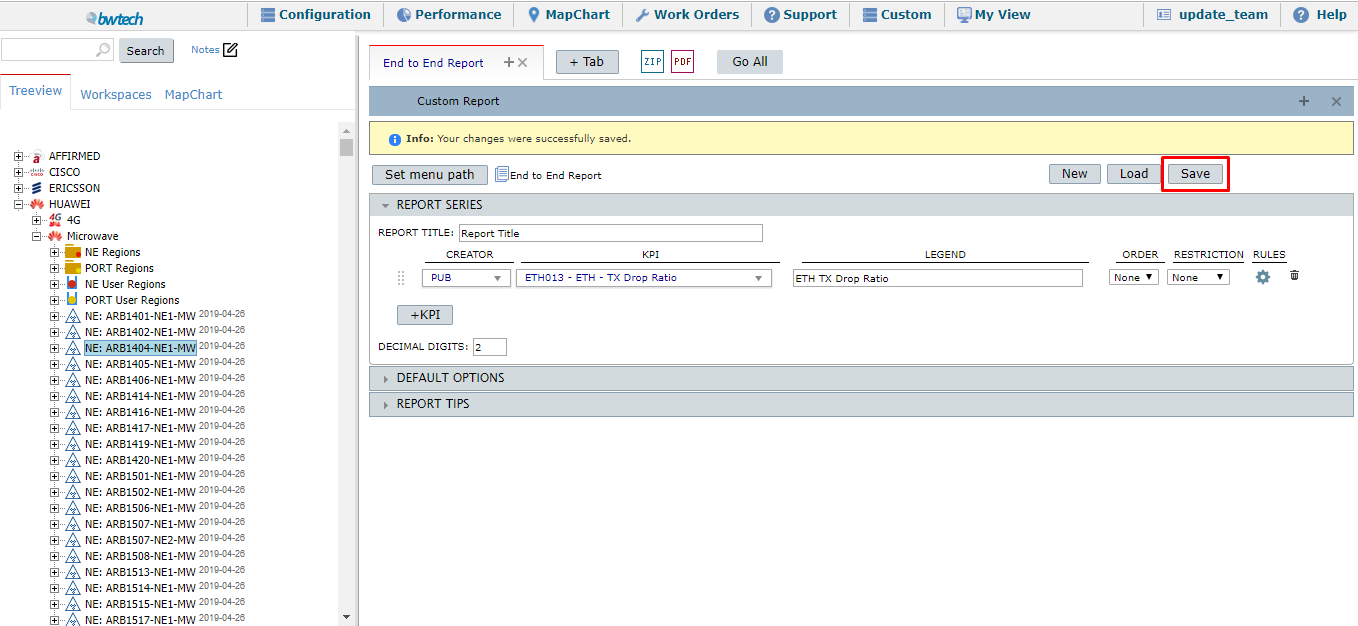
Filling all the fields on the first tab (Report Series), when expanding the second tab – Default Series – it is possible to associate the related KPI from the first tab to an End to End Report:
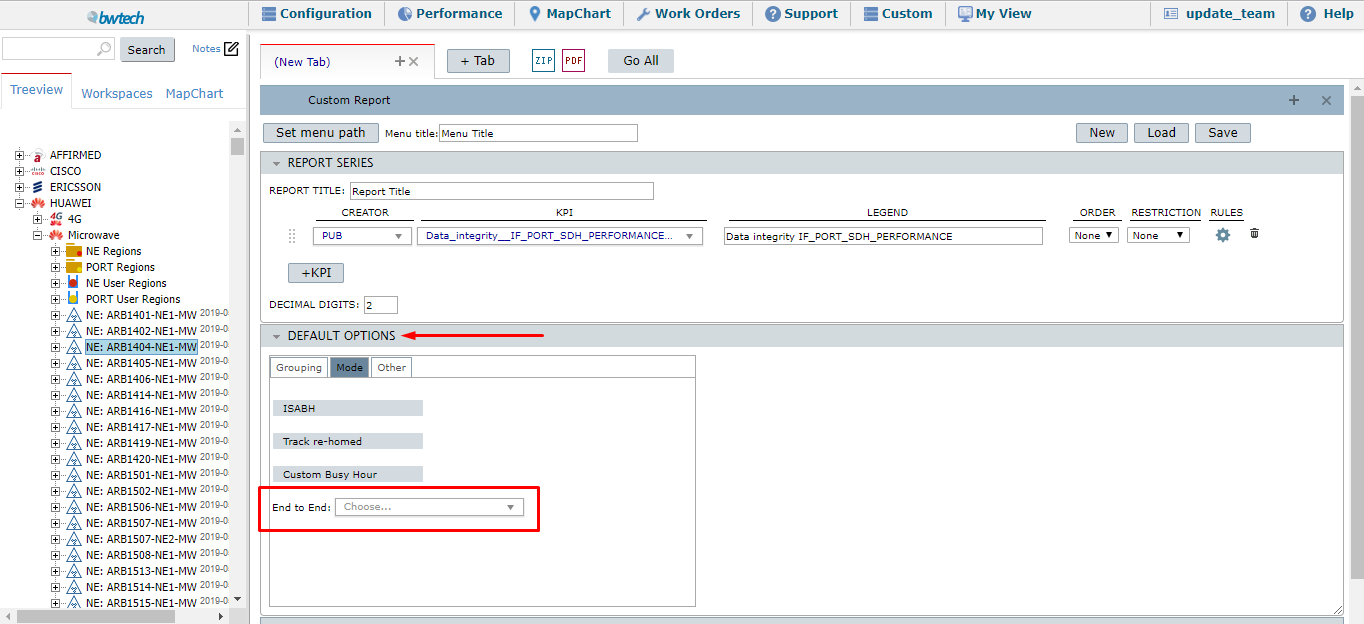
After choosing a specific End to End Report and associate it to a KPI, press Save and then the user will have this KPI linked to an End to End Report.
It is also possible to add more than one KPI, define rules, restrictions, decimal digits of the final results and the order (ascendant or descendant).
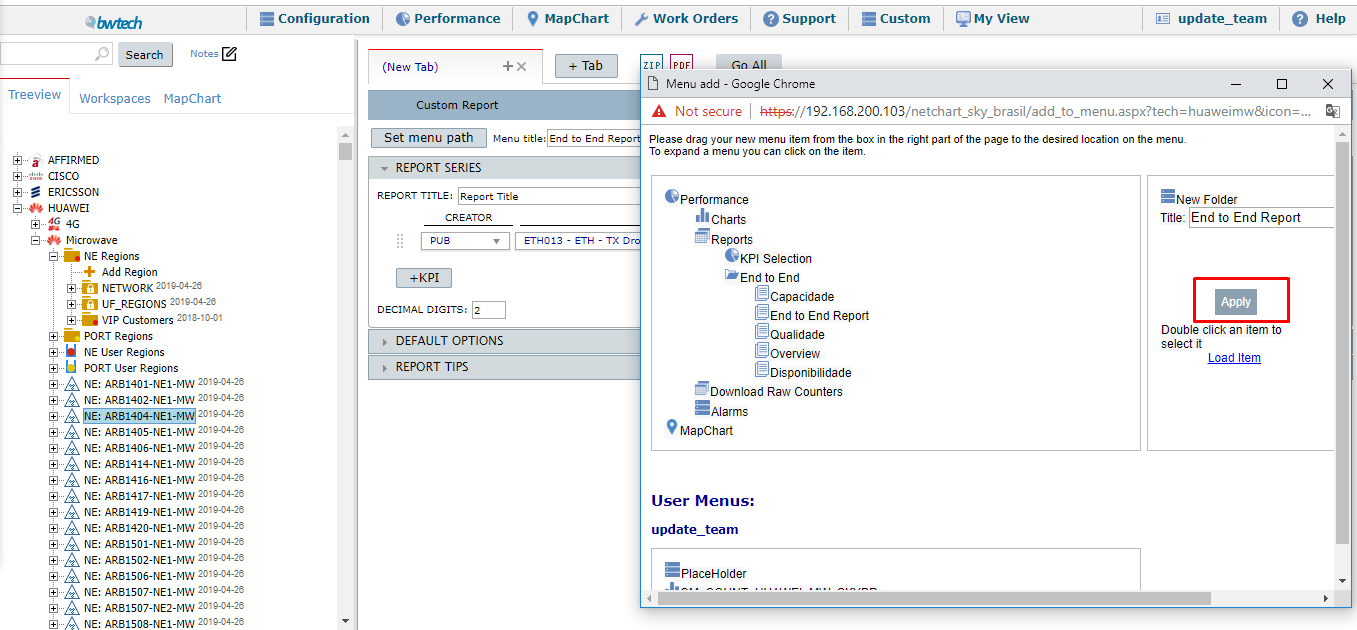
After defining all the possibilities, the user is supposed to click on Set menu path:
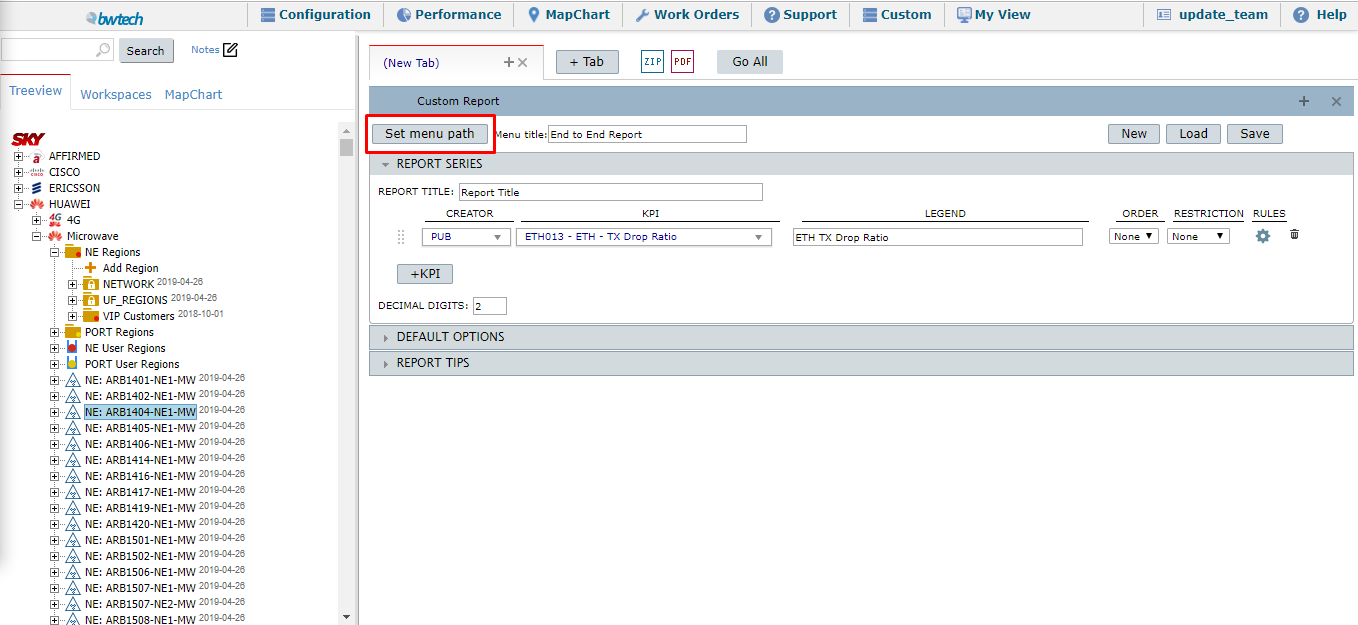
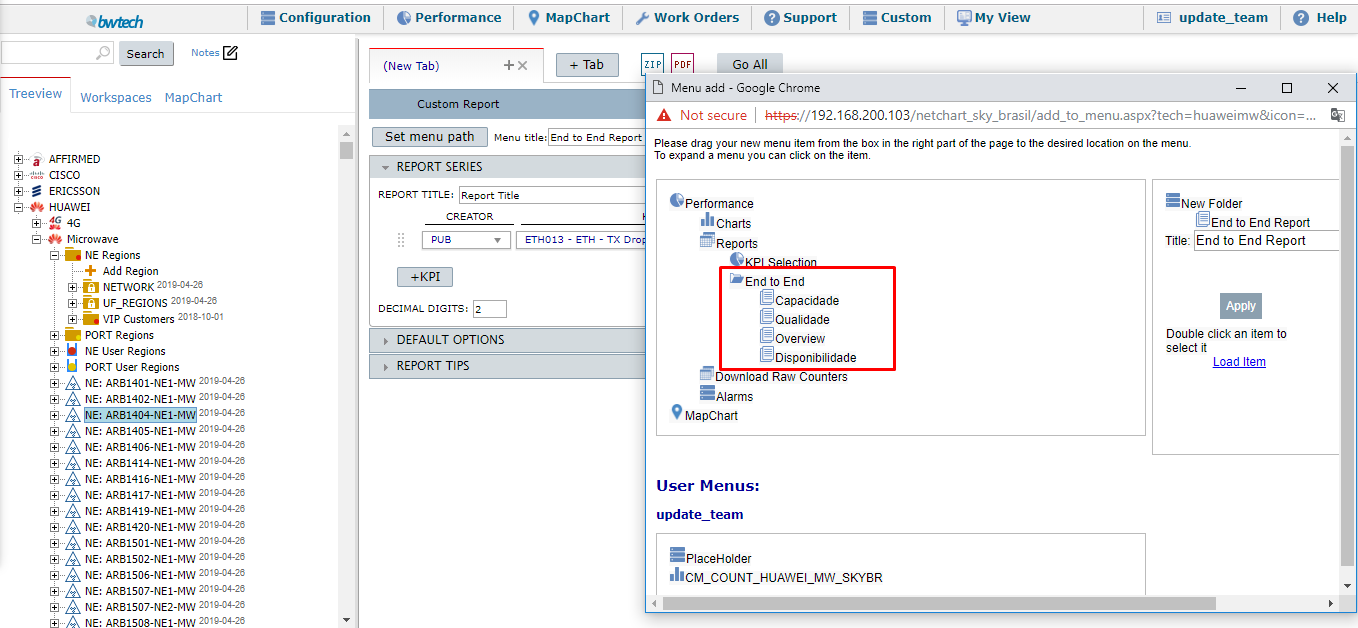
A new window will appear. In this example, the menu title chosen was “End to End Report“.
To put this report on the Menu Performance -> Reports -> End to End it is necessary to expand all this path on the left field, such as the image illustrates:
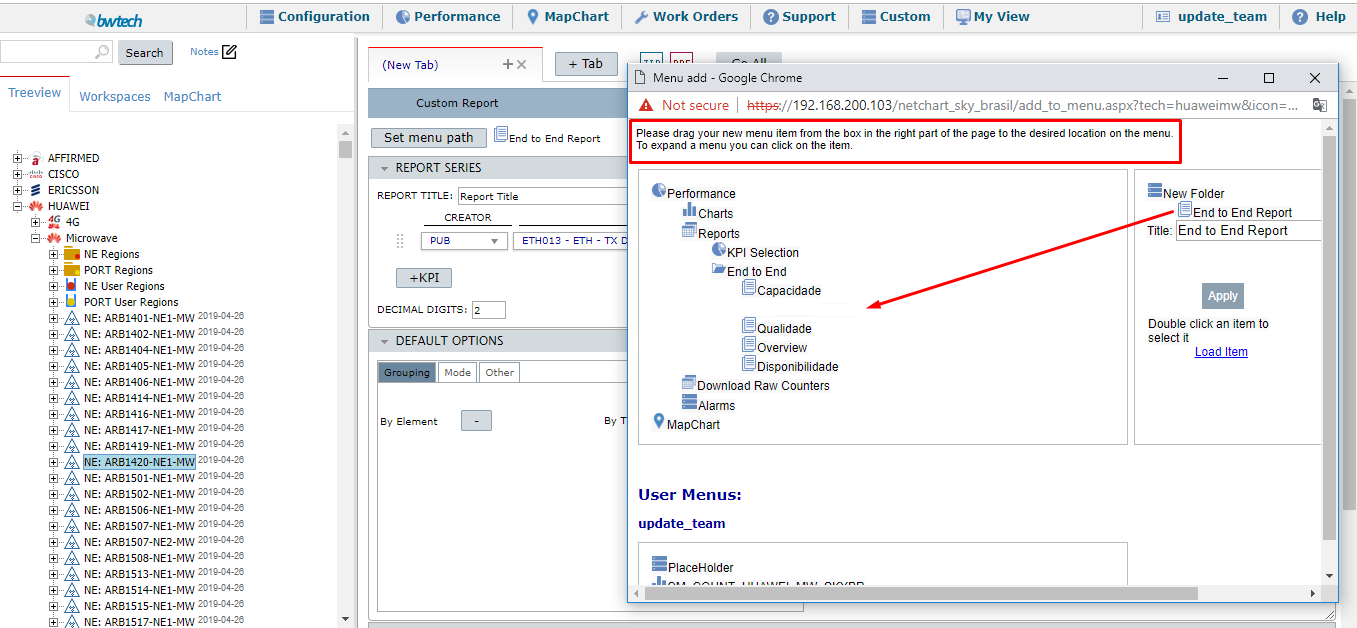
After it, drag the new menu on the right box to the desired location:
The screen is supposed to look like the next image, containing the new menu on the user’s preferable location:
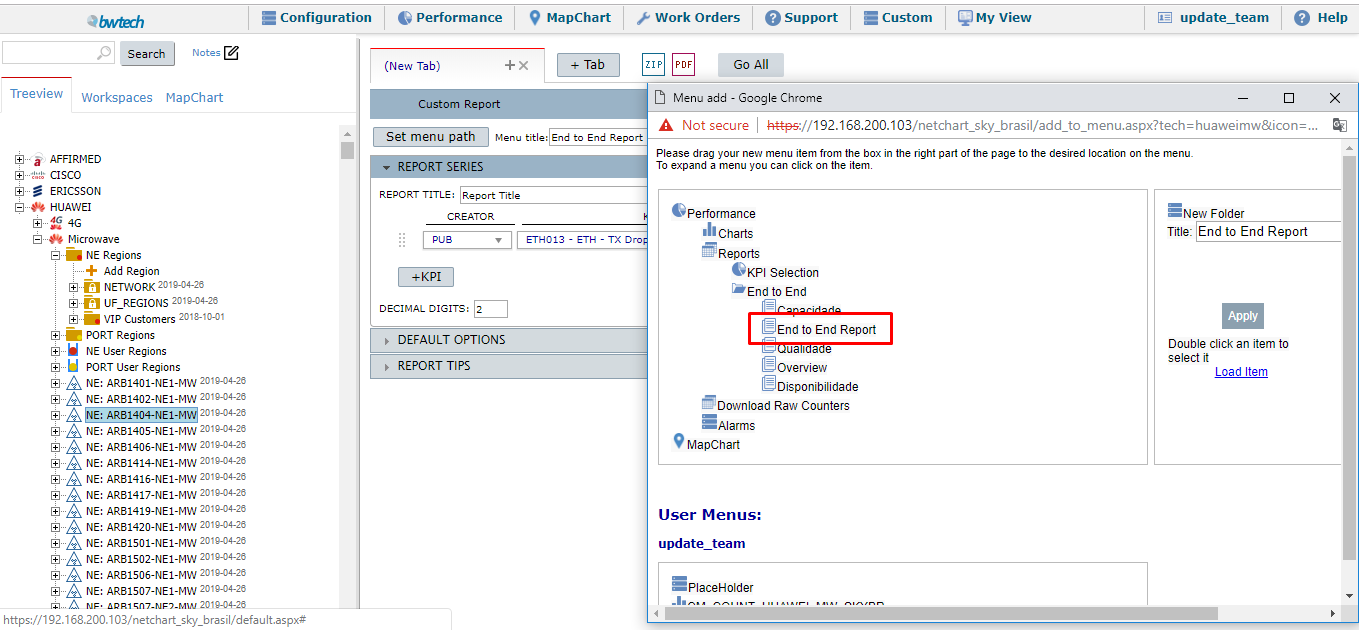
The next step is to click on Apply.
After that, the screen comes back to the previous one. Then, press Save.
Doing this process, refresh NetChart’s page and the new Report will be saved on the user’s menu, such as the model above: