PHYSICAL ALARMS
OVERVIEW
The physical alarms feature reports events, such as cabinet high temperature, power disconnection, link set unavailability, inoperative FAN, among others.
The alarm data is collected once a day and is usually related to the previous day’s events. This information can be correlated with performance data, enabling a more accurate analysis.
It also gives the user the possibility to view those alarms through charts.
HOW TO USE
Log in with your username and password.
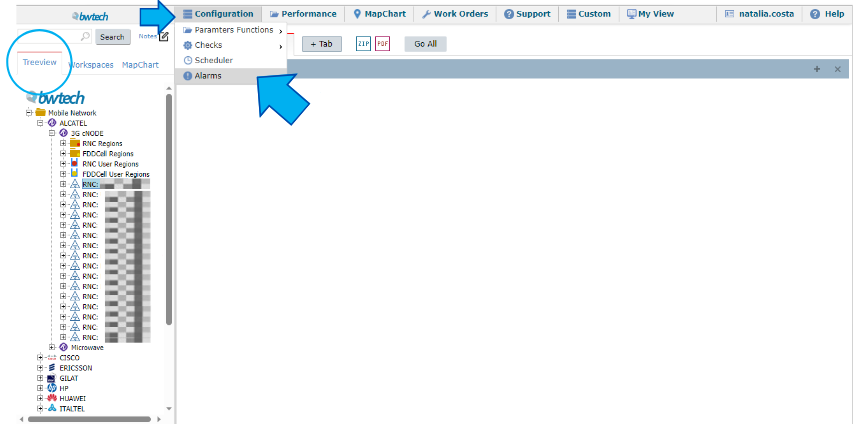
Choose an element or folder in the treeview. Select Configuration > Alarms.
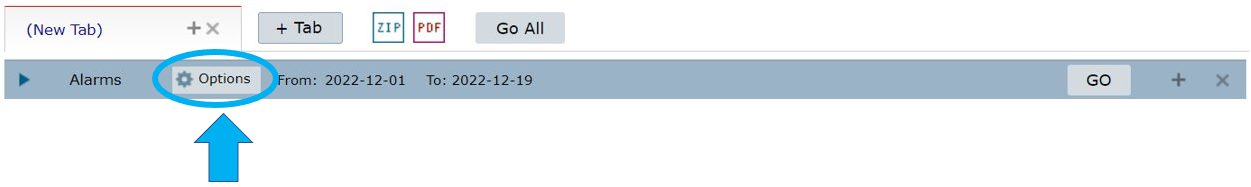
Select the Options menu in the new slot.
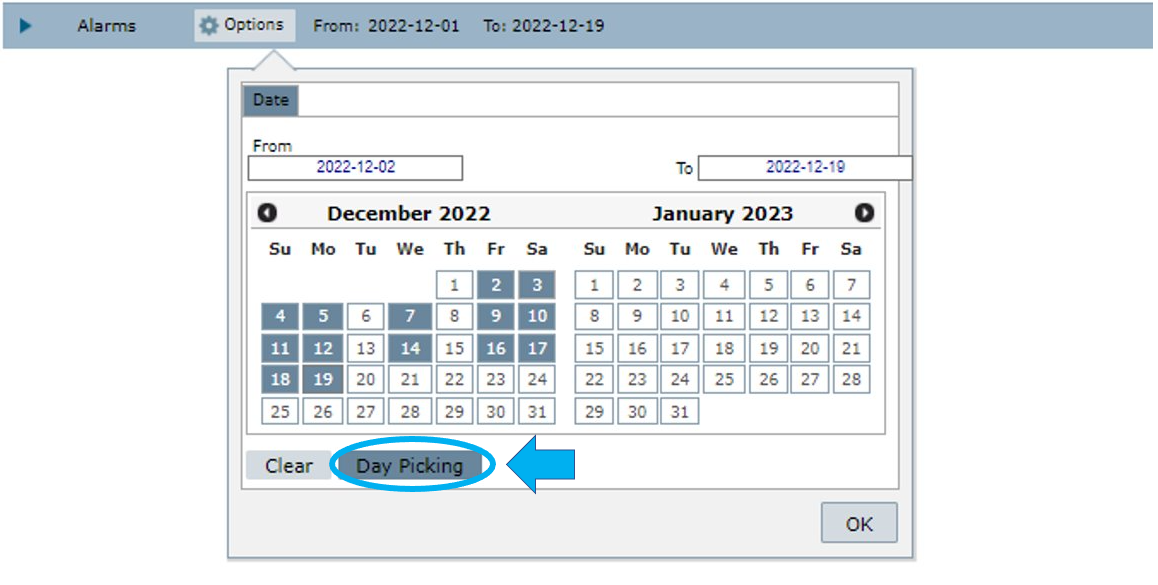
Select the dates or time frame for your consultation or write the time interval in the From and To fields.
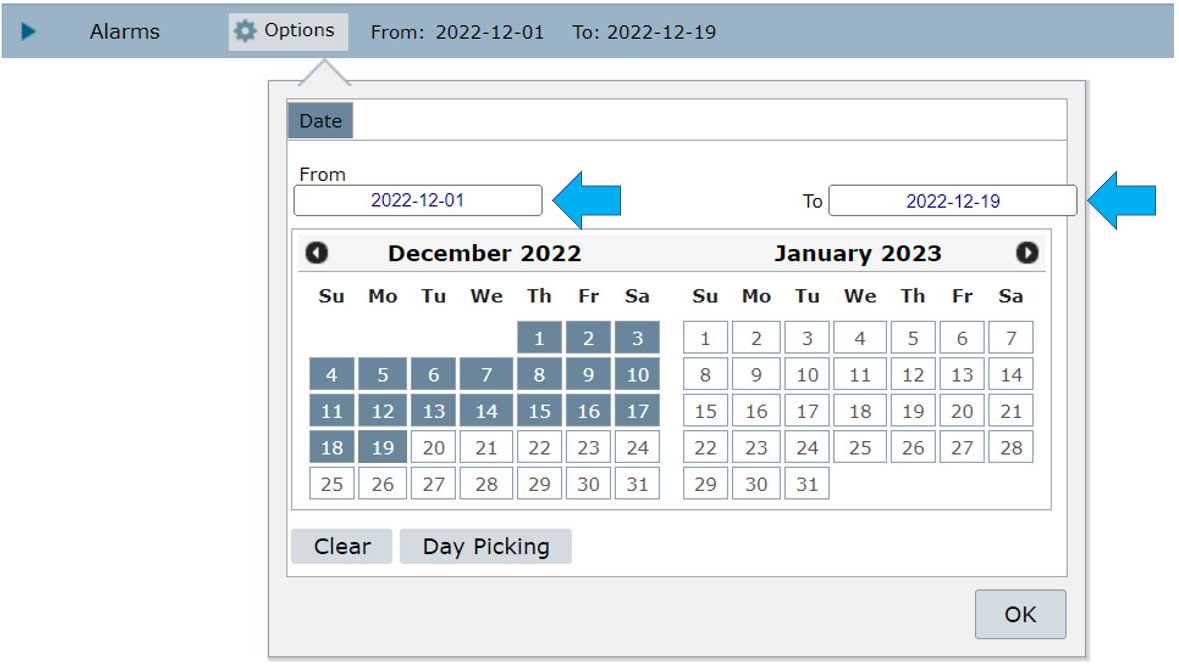
Click on:
- Clear to clear the dates selected.
- Clear > Weekends to clear all the weekends in the timeframe selected.
- Clear > Holidays to clear all the holidays in the timeframe selected.


Select Day Picking to manually choose individual dates.
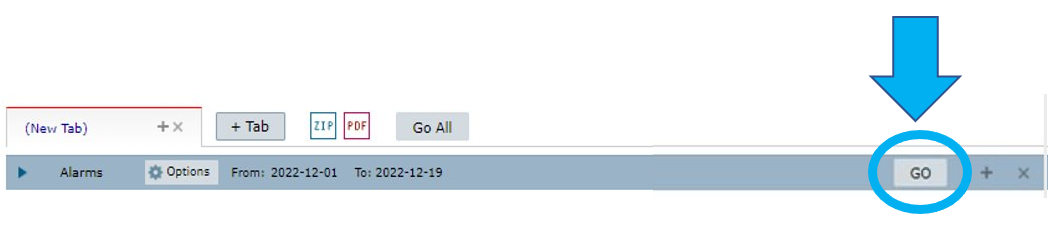
Click on Go to run the alarms.
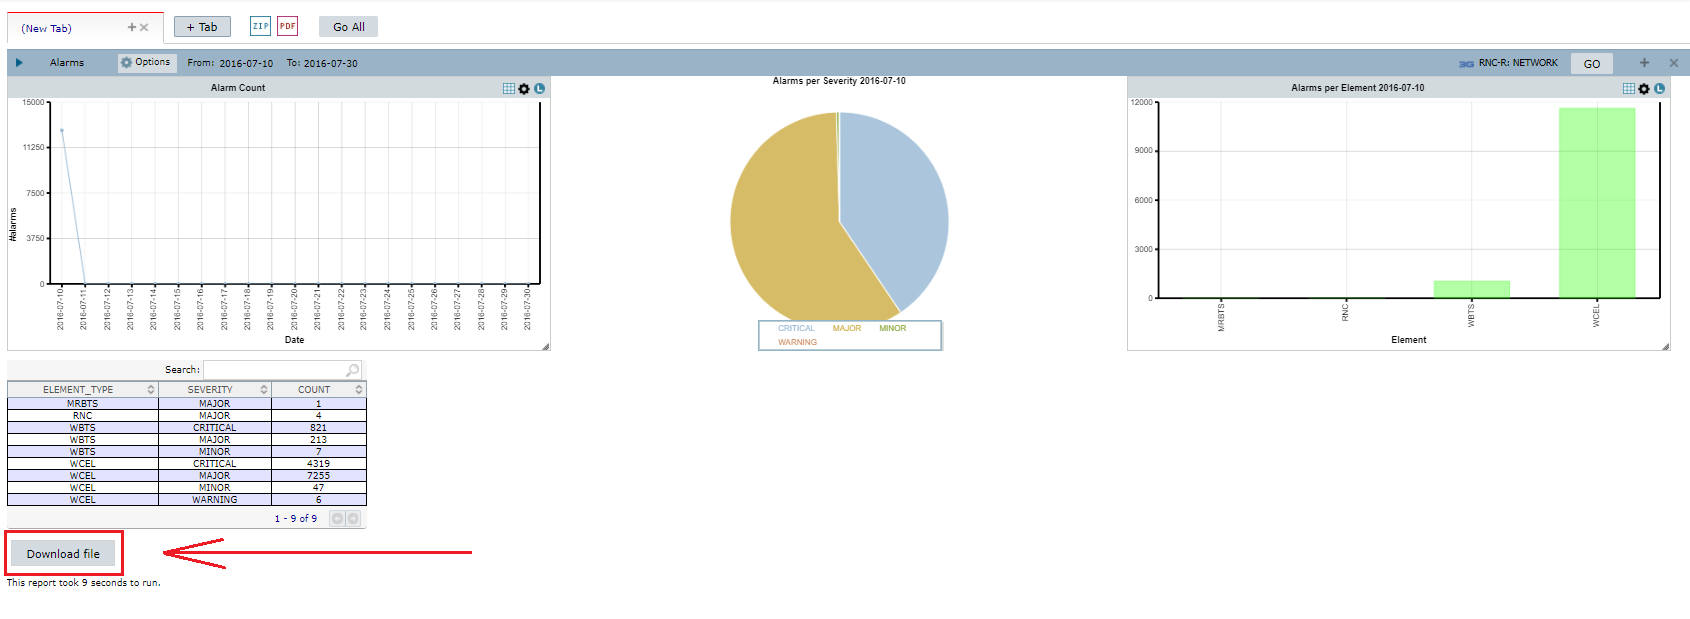
Visualize the results.

As a system default, in the first graph, you will see the historic trend for the alarms count. It plots for each day what were the alarms for that period.

The next is a pie chart that breaks down the alarms per severity – critical, major, minor and warning.

There is also a graph with the alarms per network element type.

Finally, there’s a table with the alarms’ details. It shows three columns: element type, severity and alarm count.
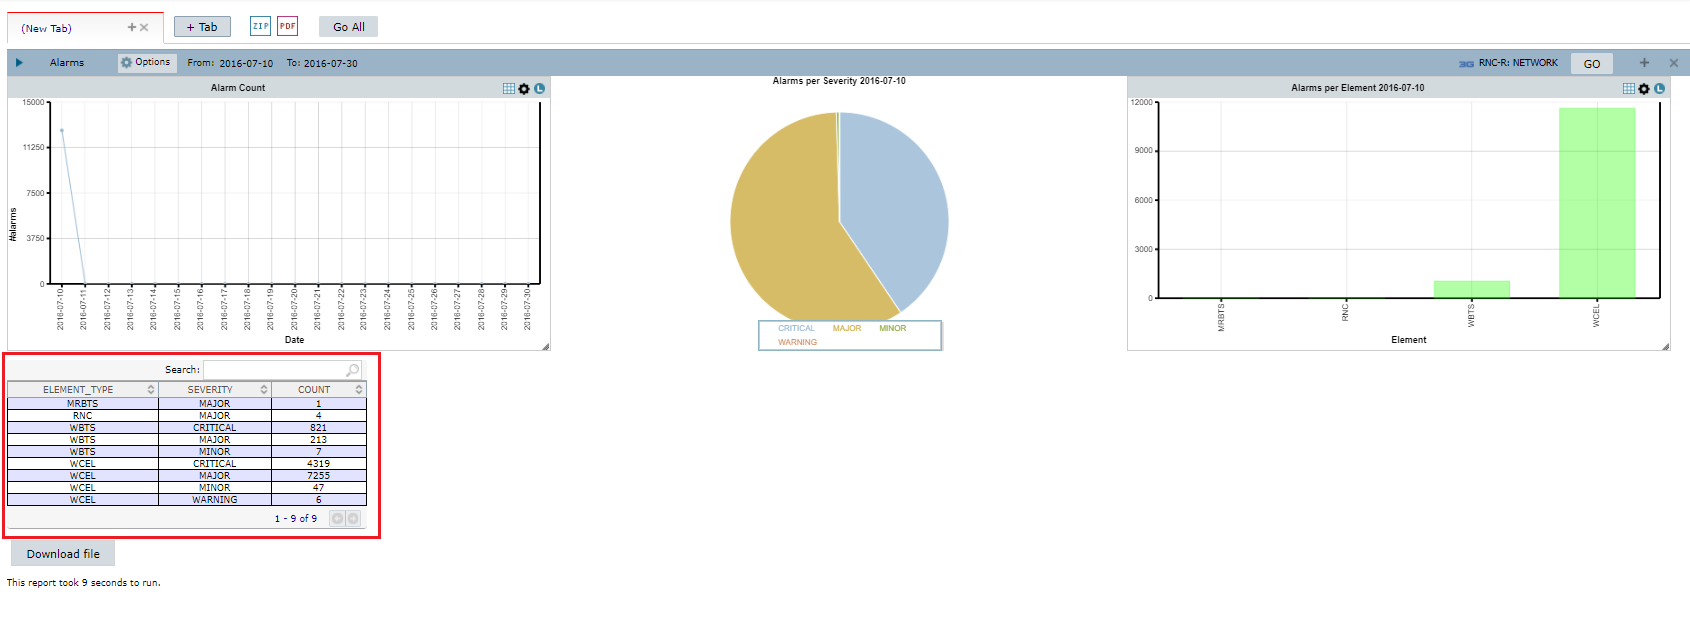
NOTE: the table updates according to the date selected in the first graph.
Click on an element on the table to see another table with details of the selected element.

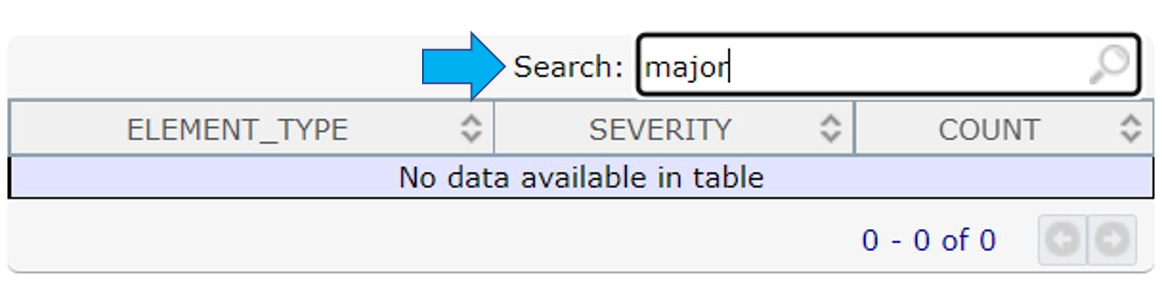
Use the Search field to search for specific results in the table.
Click on Download File to download the results.
NOTES
Some of the graphs shown in the Physical Alarms feature have a menu on the upper right side.

The first option allows you to:

1 – Generate the chart table.
2 – Download the chart’s raw data.
3 – Download the chart in the MSWord/MSExcel format.
4 – Download the chart in PDF format.
5 – Resize and show the chart legend before downloading.
Select the Configurations menu, to set the axes information, choose the trend type and add a series. Click on OK and Add after selecting the preferences.

Select the Legend menu to show or hide the chart’s legend.

COMMON ERRORS
- Choosing a folder or tech that doesn’t have physical alarms set in the system.
- Selecting a timeframe or dates that don’t have any alarms reported.