Contents
MANAGE KPI
Overview
Manage your own customized KPI directly in the interface or by importing a text file.
How to use
Log in to your NetChart account.

Single vendor/tech KPIs
Learn how to create KPI formulas for single vendor/tech.
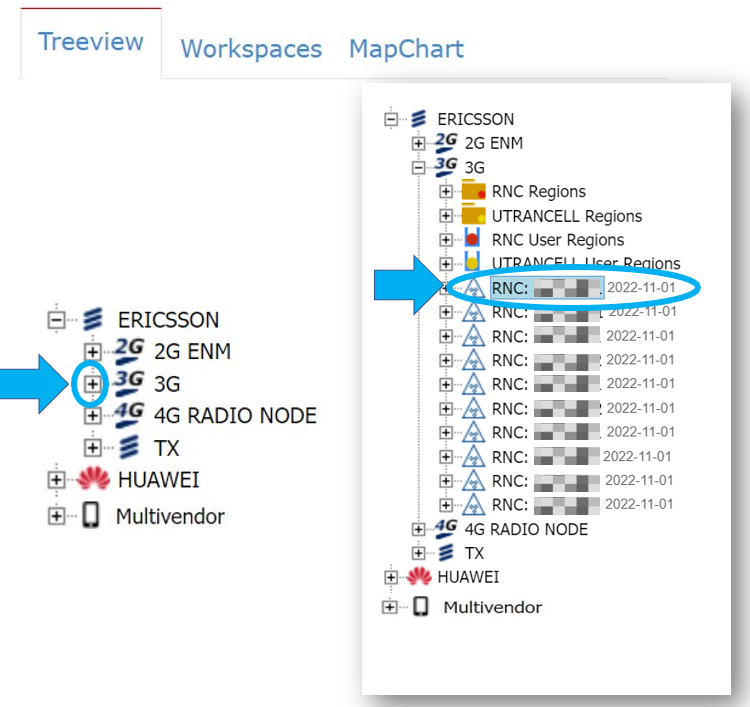
Choose a network element
Because KPI formulas are specific for each vendor/tech, the first thing you need to do is choose a network element from the desired vendor/tech.
First, click on the + icon next to the desired vendor/tech to see the network elements available. Select a network element to create a KPI from the desired vendor/tech.
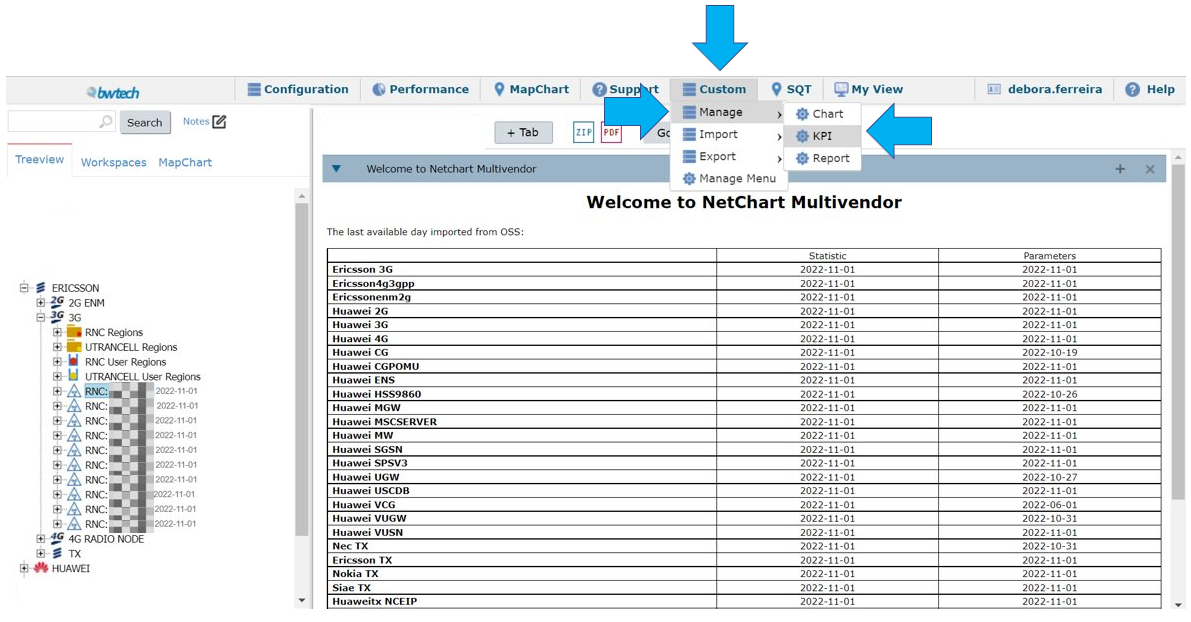
Select Custom > Manage > KPI.
Create a new KPI
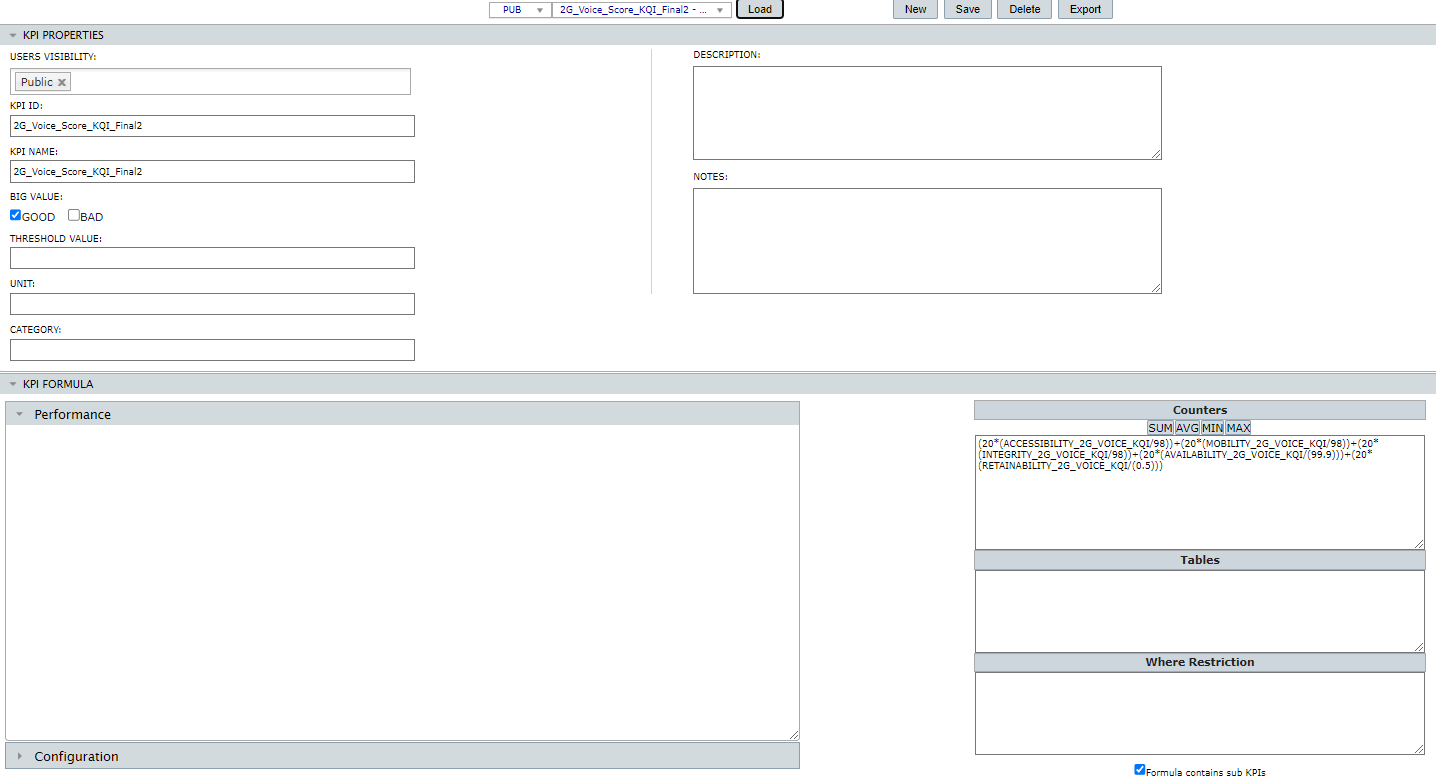
Set the KPI properties following the steps below:
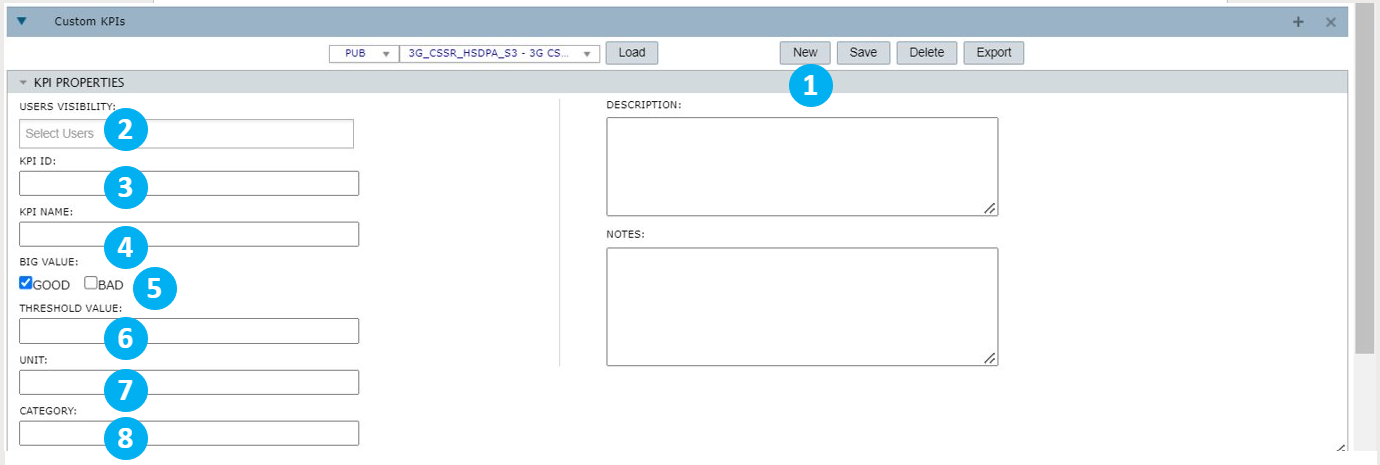
1- Select New to make sure all the fields are empty and ready to be filled.
2- Define who can see the created KPI. Select Public to make it visible to anyone.
3- Write the KPI ID. The ID is a short exclusive text to identify the KPI for the vendor/tech selected. Ex.: Ava_sr could be the ID for an Availability success ratio KPI.
NOTE: Spaces will be replaced by _ and other special characters will be removed.
4- Write the KPI name. The name is a more descriptive text. Ex.: Availability success ratio.
5- Choose GOOD if the bigger the value, the better, or BAD if the bigger the value, the worse.
6- Write a threshold value for the KPI. Ex.: If you write 50, it means that the KPI should not cross 50.
7- Write the KPI Unit. It can be in percentage, number of attempts, seconds, etc.
8- Write the KPI category. Ex.: availability, accessibility, etc.
NOTE: Items 5, 6, 7 and 8 are optional.
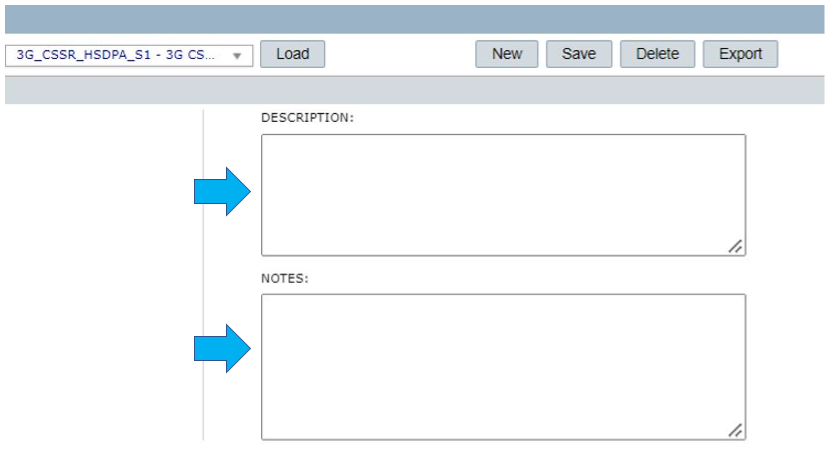
After that, write an optional detailed description and any pertinent notes for the KPI in the correct fields.
Continue filling in the KPI properties.
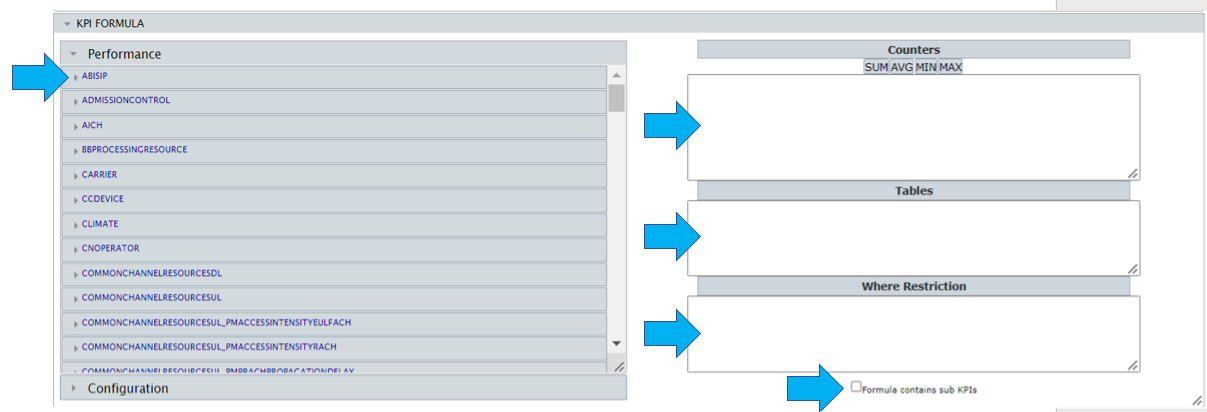
- Under Performance, see the available tables of performance to the selected vendor/tech and choose the desired counter by dragging and dropping them in the Counters field.
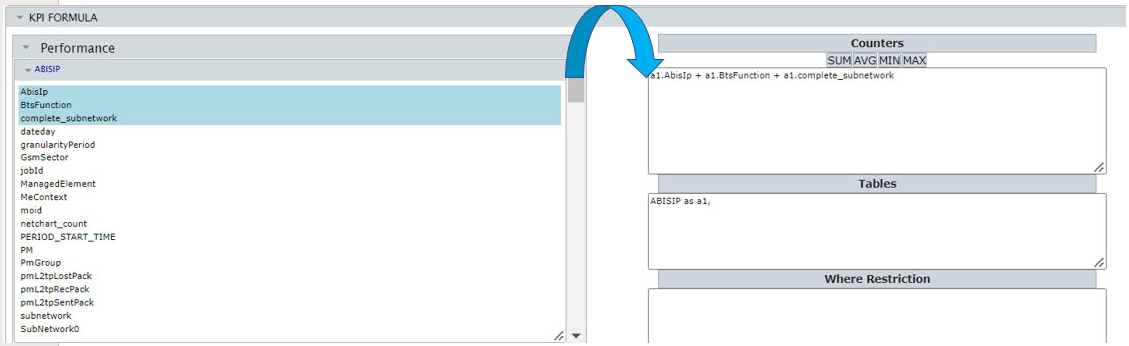
- In the Counters field, write/edit the KPI formula in line.
- Inside the Tables field, write the performance table related to the formula with an alias (as a, b, etc).
- In the Where Restriction field, write the conditional statement, in case you want to restrict the results based on any counter.
- Check the Formula contains subKPIs box if it contains other KPIs (i.e.: (rnc_727a + rnc_183c)/2).
NOTE: Normally the KPI Formula is a SUM or AVG (average) of a few counters. If counters from more than one table are used, it is necessary to put an alias of the table in front of each counter. (i.e.: a.counter1; qos.counter2.) In this case, the alias should be also present in the statistic table description.
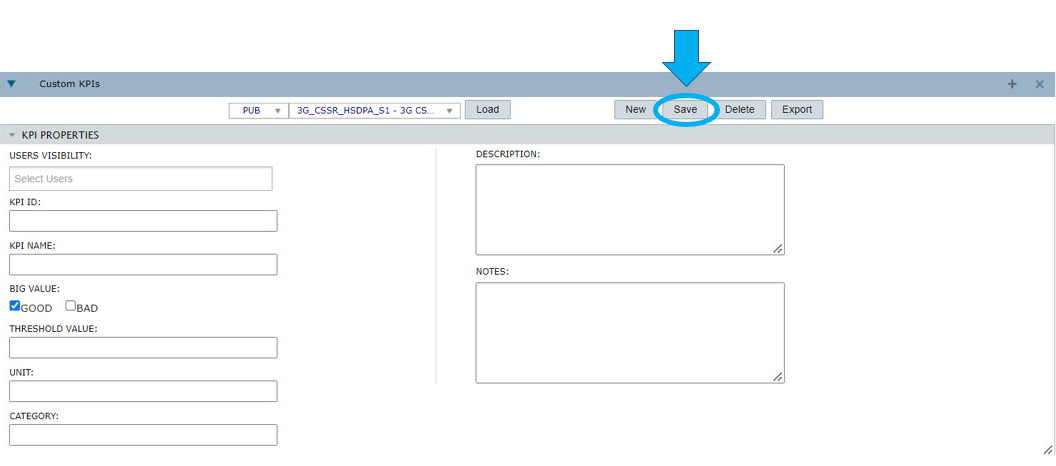
Select Save to finish the creation of the KPI.
Edit an existing KPI
Edit the properties of an existing KPI by following the steps below:
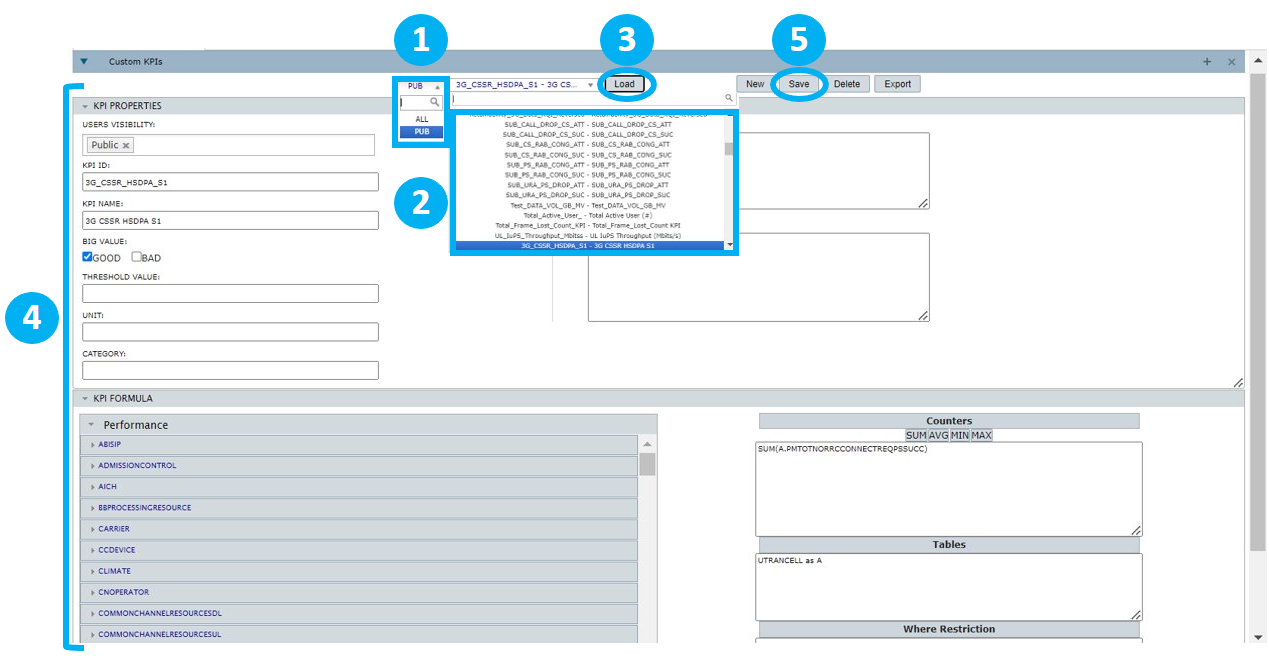
1- Select the desired visibility. Choose PUB to filter for public KPIs available, ALL to filter for all KPIs, or a user’s name for private KPIs.
2- Choose the desired KPI.
3- Select Load.
4- Edit the desired properties in their corresponding fields.
5- Select Save to apply the changes made.
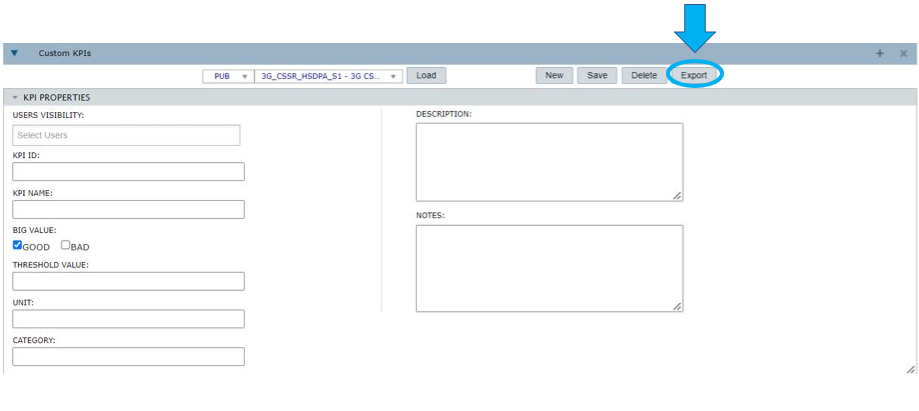
Export a KPI
Select Export to export the currently selected KPI into a text file (TXT).
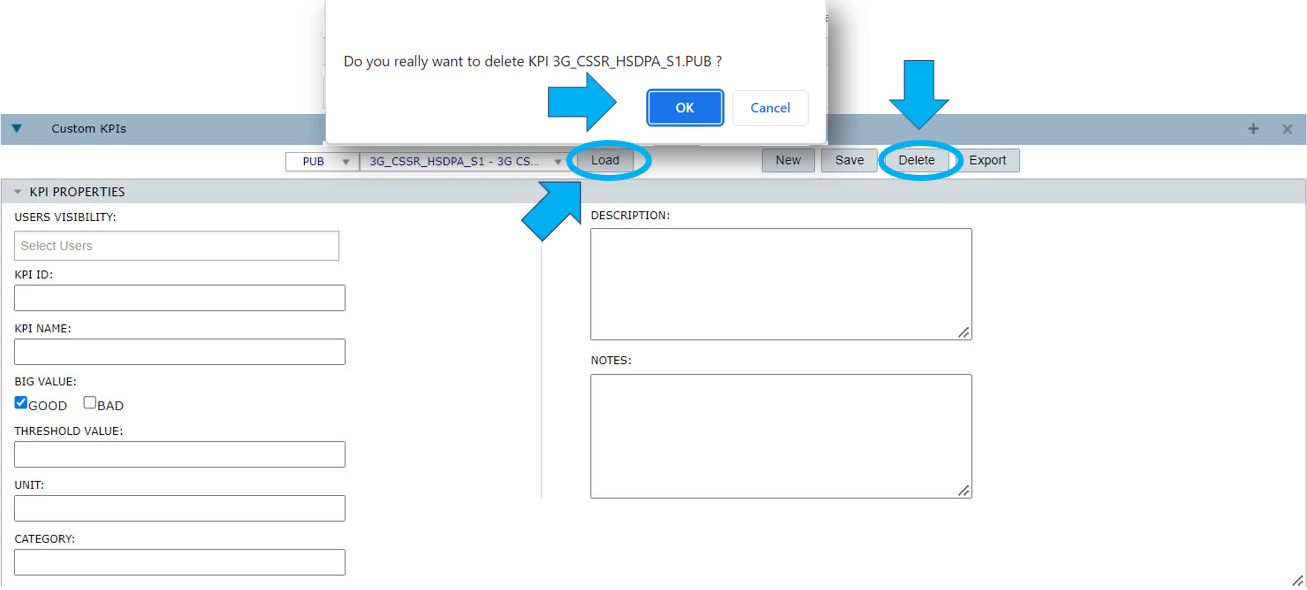
Delete a KPI
After choosing the KPI you want to delete, select Load and then, Delete. Select OK to confirm the action or Cancel to give up on the action.
Special functions
You can use the following functions when editing your formula:
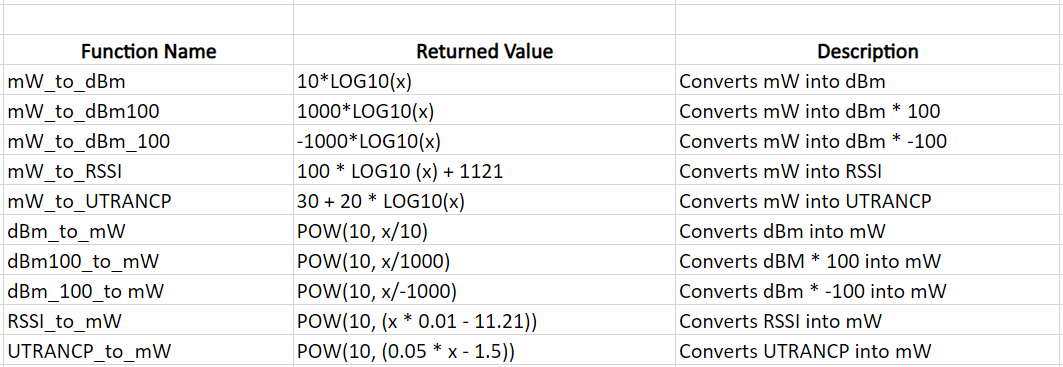
Example: sum (RSSI_to_mW(tableAlias.the_counter)) – returns the sum of all values for the element in mW.
Multivendor KPIs
Learn how to create Multivendor KPIs.
Create multivendor KPIs
There are two types of formula for processing Multivendor KPIs: the standard one and the customized one.
NetChart standard formula
Multivendor standard KPIs are the ones that share the same KPI_ID in two or more vendors/techs.
This means that if you want to analyze the availability KPIs for Ericsson and Huawei, you must create both KPIs with the same name for each vendor.
The data sum in Multivendor is not direct, that is, the system does not take each column value and sum it.
First of all, NetChart breaks each KPI from each tech into numerator and denominator. This happens because each vendor has its own formula to calculate the KPI and different ways to show this data.
Then, the system sums all the numerators and all the denominators. Only after that, it makes the division: numerator sum/denominator sum. This is the formula that gives the final value of the KPI for the tech.
NetChart customized formula
This feature allows for the creation of a Multivendor formula that combines Multivendor standard KPIs.
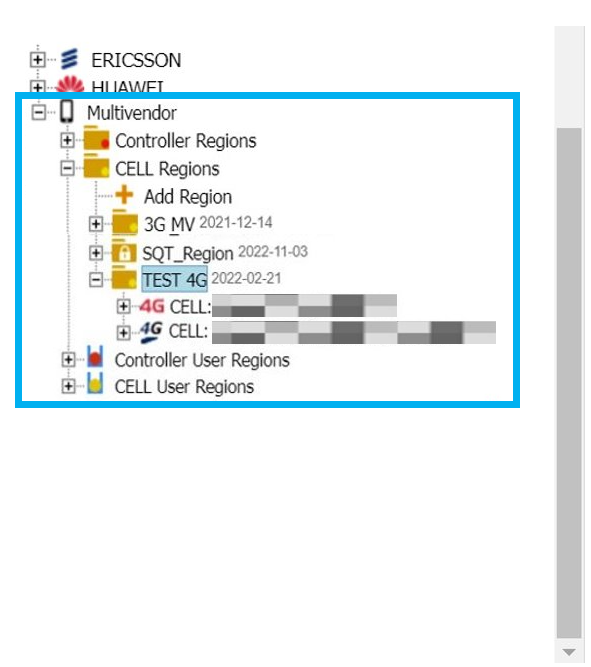
First, select a Multivendor region.
After that, proceed with the creation of the Multivendor KPIs.
This process follows the same steps as the ones for the creation of Standard KPIs. To view the step by step, refer to the Create a new KPI section.
For the formula, notice that the Performance field is empty. This is because there are no Multivendor counters.
Make sure to check the Formula contains subKPIs box when creating the formula combining the Multivendor standard KPI IDs
Since the Tables and Where Restriction fields are used only for single vendor/tech counters, they must not be filled in when creating Multivendor KPI formulas.
Edit/delete multivendor KPIs
The editing and exclusion of Multivendor KPIs follow the same procedures from the Single vendor/tech ones. To obtain more information on how to edit or delete KPIs, refer to the Edit an existing KPI and Delete a KPI sections.
Formula Oracle x MySQL
NetChart uses the database MySQL, so some KPI formulas need to be converted from the Oracle database. Almost all functions have the same syntax, such as SUM, AVG, MAX, MIN, POW, ROUND, but there are some differences like NVL, DECODE, etc. Therefore, sometimes, adaptations are necessary.
See an example of where this adaptation was necessary. Observe that the formulas are exactly the same.
Original formula:
nvl(decode(sum(NBR_OF_RLS),0,NULL, round(10*log(10,( SUM( (0.001 * power( 10, ( (-10+(AVE_TRX_FOR_RL_IN_CELL/2 ) )/10) ) ) * (NBR_OF_RLS) ) /SUM(NBR_OF_RLS ) ) /0.001 ) ,2) ),0)
nvl(x,y) – Oracle function that substitutes result of formula with y if x = null.
It must be removed because NetChart will return the result as 0 in cases where the KPI value is null.
Removing nvl part from KPI:
decode(sum(NBR_OF_RLS),0,NULL, round(10*log(10,( SUM( (0.001 * power( 10, ( (-10+(AVE_TRX_FOR_RL_IN_CELL/2 ) )/10) ) ) * (NBR_OF_RLS) ) /SUM(NBR_OF_RLS ) ) /0.001 ) ,2) )
decode(x, y, z, w) – Oracle function. If x=y result is z, otherwise result is w. The purpose here is to check if NBR_OF_RLS is zero. If yes, formula result is null, otherwise result is round ( … ).
It can be removed, because in MySQL, this part is not needed.
round(10*log(10,( SUM( (0.001 * power( 10, ( (-10+(AVE_TRX_FOR_RL_IN_CELL/2 ) )/10) ) ) * (NBR_OF_RLS) ) /SUM(NBR_OF_RLS ) ) /0.001 ) ,2)
The round, log, SUM and power functions have the same syntax in MySQL as in Oracle, so the formula above can be used as it is.
It’s exactly the same as in NetChart (the only difference is that NetChart formula is using table alias t33):
round( 10*log(10, ( SUM( (0.001*power( 10,( (-10+(t33.AVE_TRX_FOR_RL_IN_CELL/2 ) )/10 ) ) ) * (t33.NBR_OF_RLS) ) /SUM( t33.NBR_OF_RLS ) ) /0.001 ) ,2)
Ceate KPIs importing a text file
To create one or more KPIs by importing a text file,
- Choose the vendor/tech and the network element.
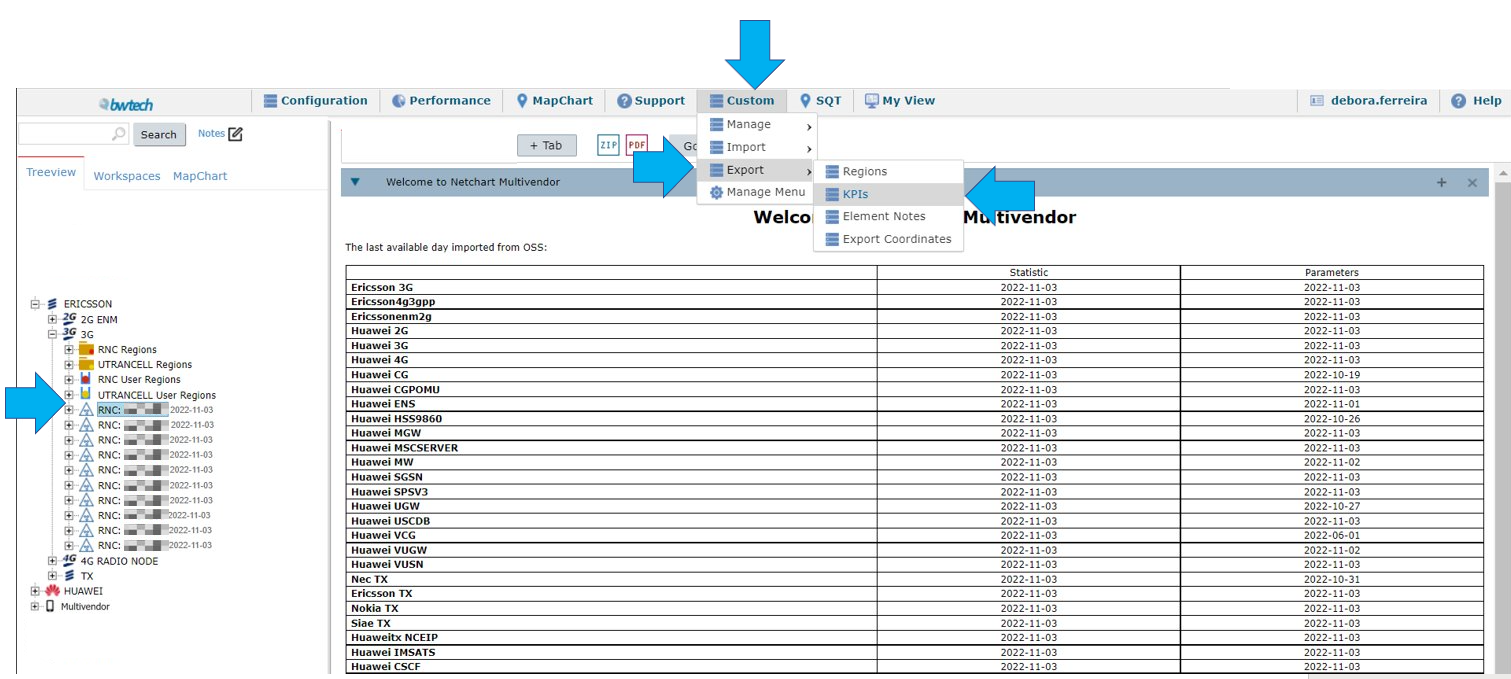
- Select Custom > Import >KPIs
Follow the steps below to continue with the process.
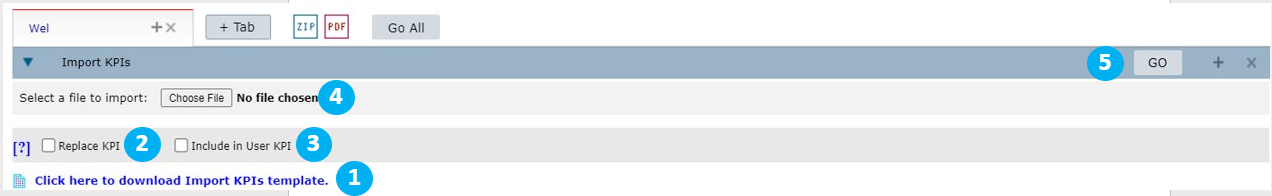
1 –Click here to download the Import KPIs template.
Fill in the template with the information of the KPIs to be created/updated, separating each one per line in the spreadsheet. You can download the .TXT template file, edit the KPIs in an EXCEL spreadsheet, save it as .TXT file and upload it.
2 – Check this box to replace the KPI if it already exists.
3 – Check this box to include the KPI as private.
4 – Select Choose File to import the KPI file.
5 – Select Go to create the KPIs.
Export KPIs
To export the KPIs available on NetChart by importing a text file, you need to:
- Choose the vendor/tech and network element.
- Click on Custom > Export > KPIs
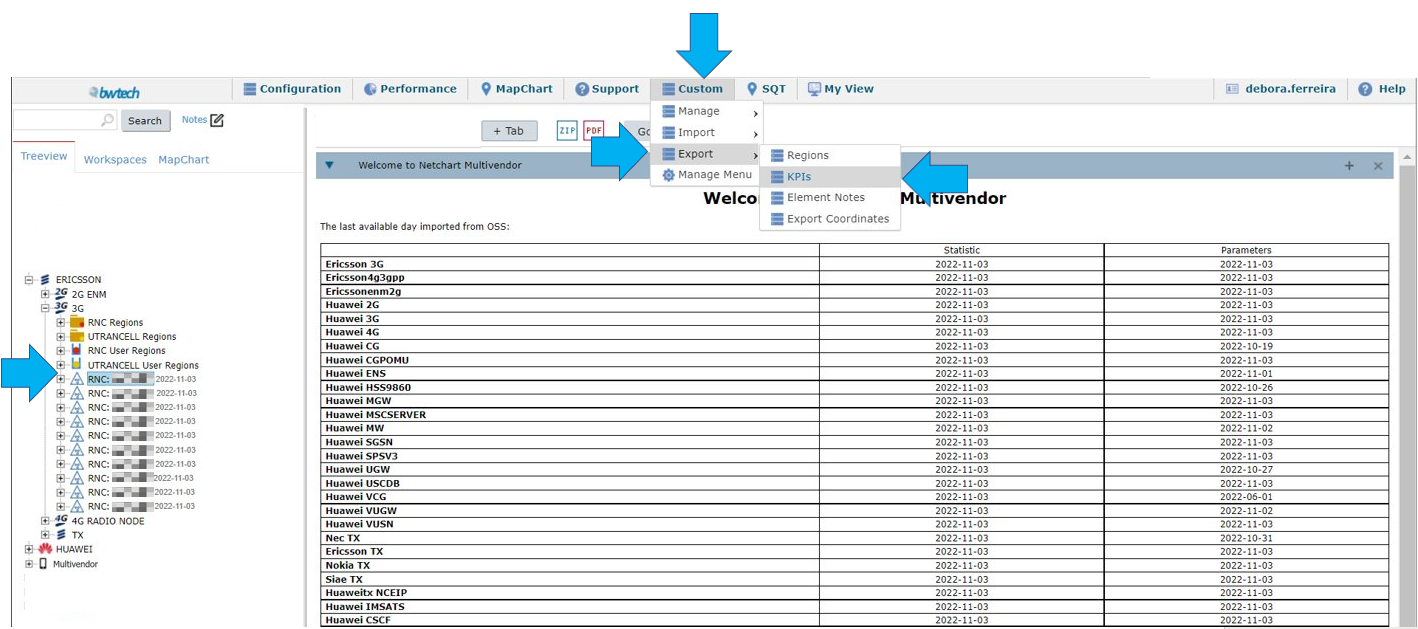
The displayed KPIs are loaded according to the selected network element in the treeview.
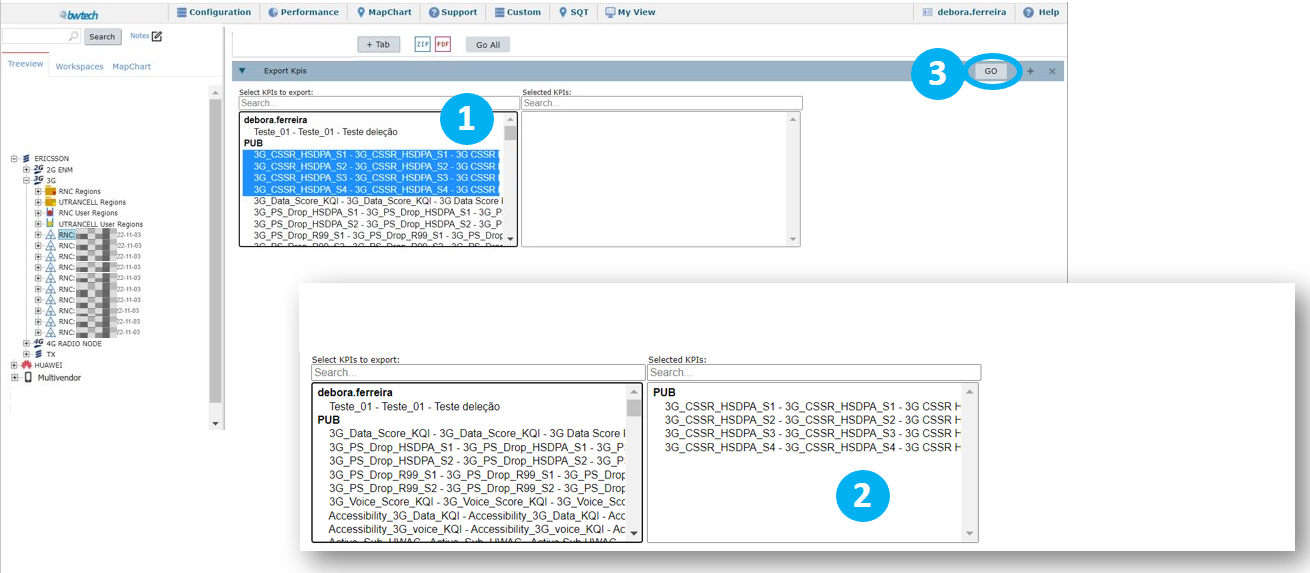
1 – Select the KPIs.
NOTE: Hold ‘Ctrl’ to select multiple KPIs.
2 – Press Enter on your keyboard to move the KPIs to the Selected KPIs field.
3 – Select Go to export the KPIs.
Common errors
- Missed alias: Make sure that all counters have table alias if it’s used.
- Missed aggregation: Make sure that there is a function to aggregate counters (SUM, AVG, MIN, MAX).
- Missed Sub KPIs checkbox: Make sure that the Formula contains subKPIs checkbox is selected when there are other KPIs present in the formula.