OVERVIEW
NetChart is a web-based Configuration and Performance Management tool designed to analyse and present radio, transmission, and core statistics of 2G, 3G, 4G, and 5G. Multiple and detailed statistical data are available for all network element levels.
NetChart can be correlated in the followings modules:
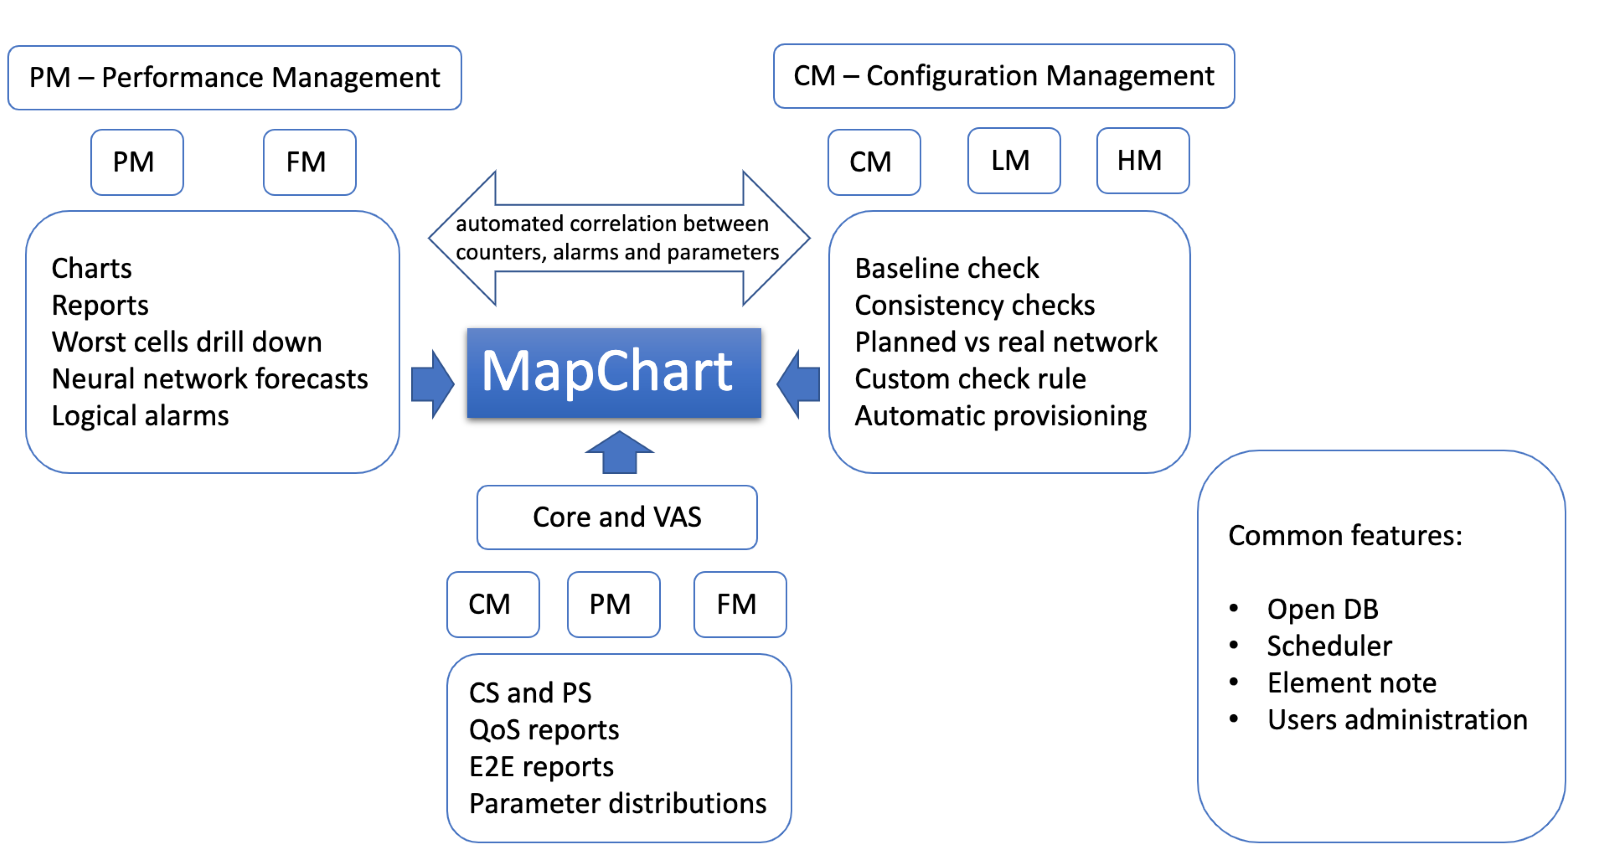
NetChart’s main features are:
- Multivendor and multi-technology.
- KPI Performance, Network Configuration, Baseline Checks.
- Configuration analysis through parameter history and consistency checks.
- Automatic creation of XML and MML files for inconsistencies correction.
- Alarm analysis through tables and detailed causes.
- Management Reports, Work Orders.
- Customization of KPIs, Charts, and Reports.
- Scheduler functions.
- MapChart.
- Geolocation and trace analysis.
- Intuitive and rich user interface.
- Short set-up time and no need for hardware or software installation.
- Software as a Service Delivery Model.
Along with all its software benefits, NetChart offers individual user support. Our development team is composed of experienced optimization engineers and senior managers, who are always reachable and ready to help, solve questions or include new features into the tool at [email protected].
How to use
NetChart’s user interface is intuitive and easy to use.
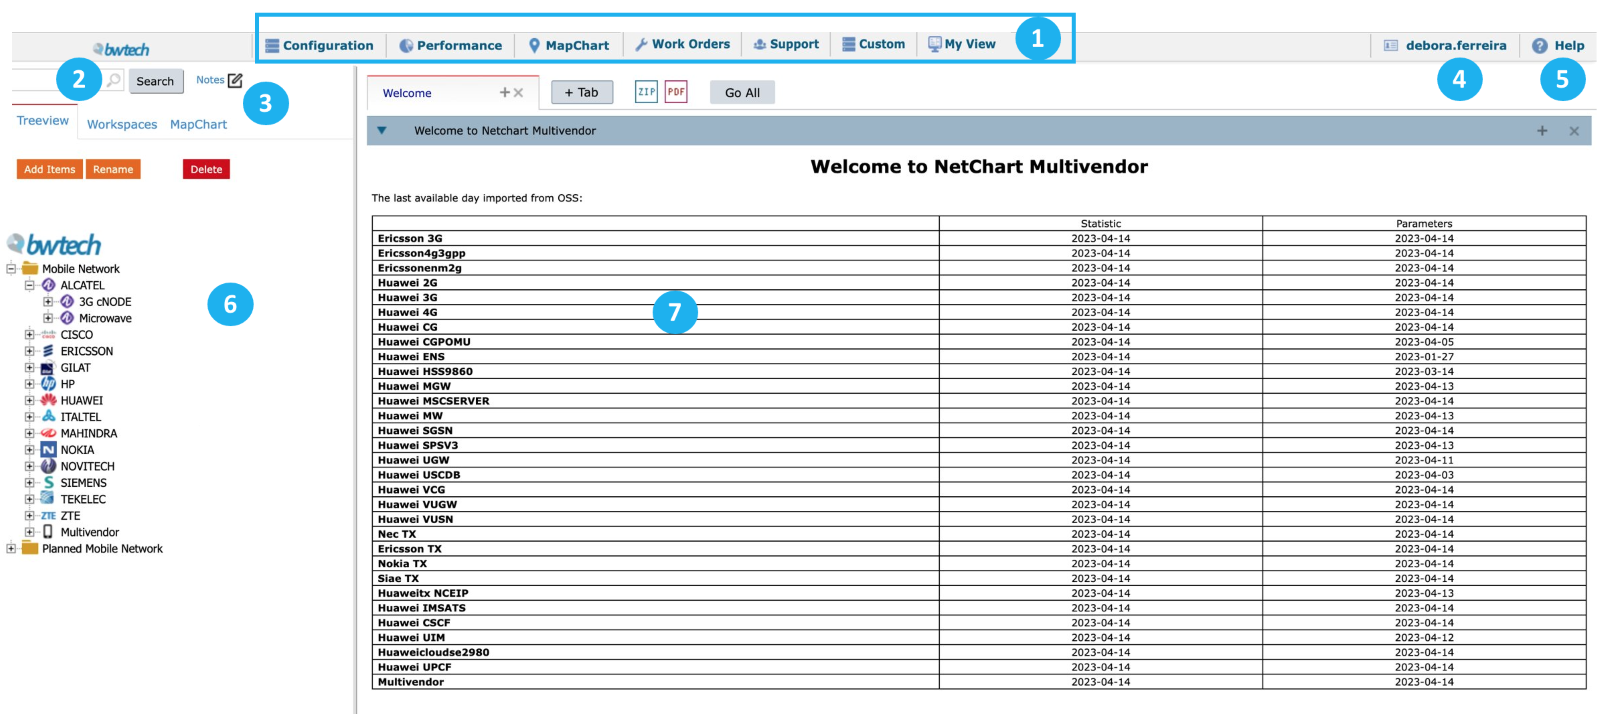
1 – View all the available menus on the top. They are separated by function.
2 – Search by the element, parameter, counter, KPI or Menu. Read the Search user guide to learn more about this function.
3 – Select the User Notes window for the selected element to write notes for future reference Read the Notes user guide to learn more about this feature.
4 – Select your username to define the user preferences.
5 – Select the Help button to learn more about NetChart’s features.
6 – View all available elements in the treeview, separated by vendors and technologies, and arranged hierarchically.
7 – View a summary of the last available day imported from OSS.