Contents
UDD
OVERVIEW
The User Defined Definitions (UDD) is a NetChart feature that allows the user to group elements according to its network organization. This means that the user can have a more dynamic way to arrange the network, following the types of classifications they already use.
Example: In your network, you can have different classifications for your cells. You can group the ones that are in the same city into a “Name of the City” region. Then, in this new region, separate the cells that belong to a specific district and divide them into clusters and so on.
The feature also has a great advantage since it allows the UDDs to be automatically updated.
UPDATING CELL CLASSIFICATION
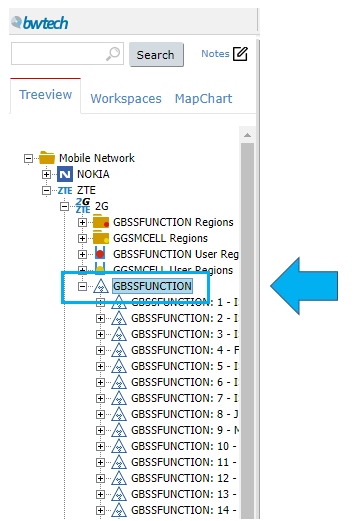
The first step is to export a NetChart file with all the information about the cells, site or controller regions you want to arrange using the UDD. To do that, select the element you want to extract the information in the treeview.
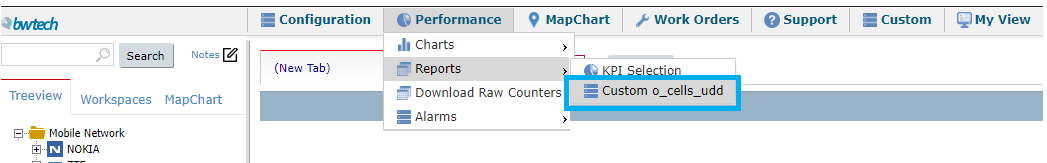
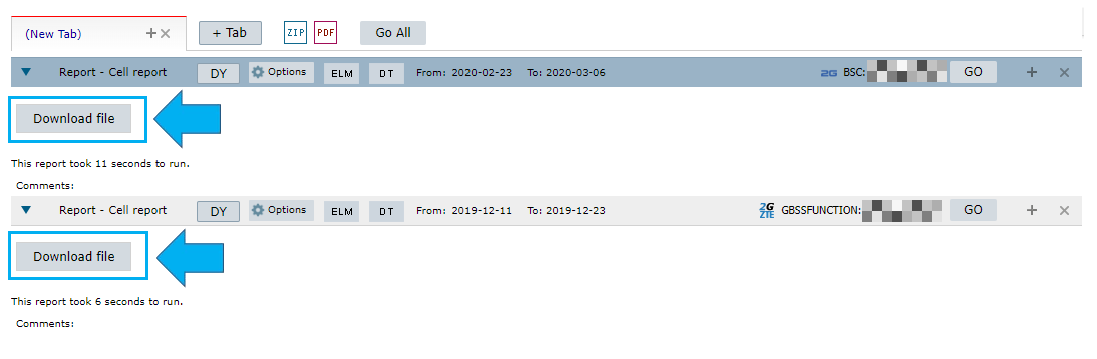
Then, go to the Performance menu, select the Report option and click on Custom o_cells_udd.
A new tab will appear and you just have to click on the Go button.
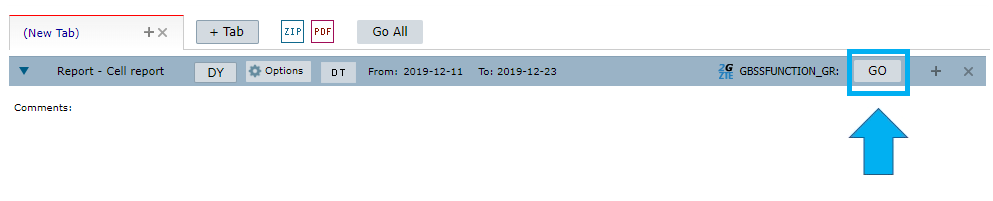
Then, the system will generate a .txt document with all the element’s data. And you can do that to all the elements you need.
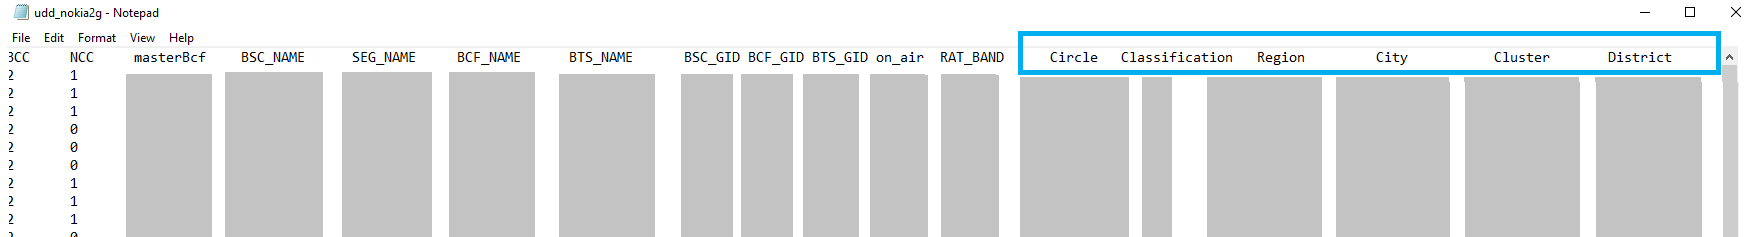
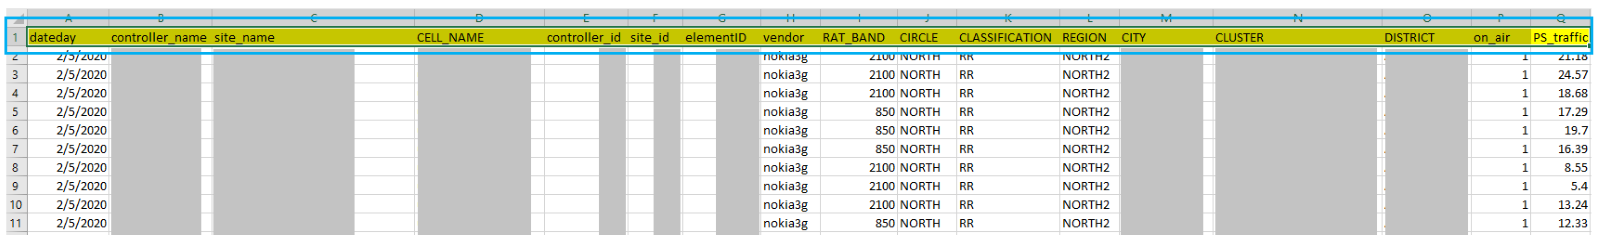
With the information gathered you now can create a .txt document that contains all your User Defined Definitions. It is a template provided by the NetChart team and it has all the information necessary for them to create the UDD regions.
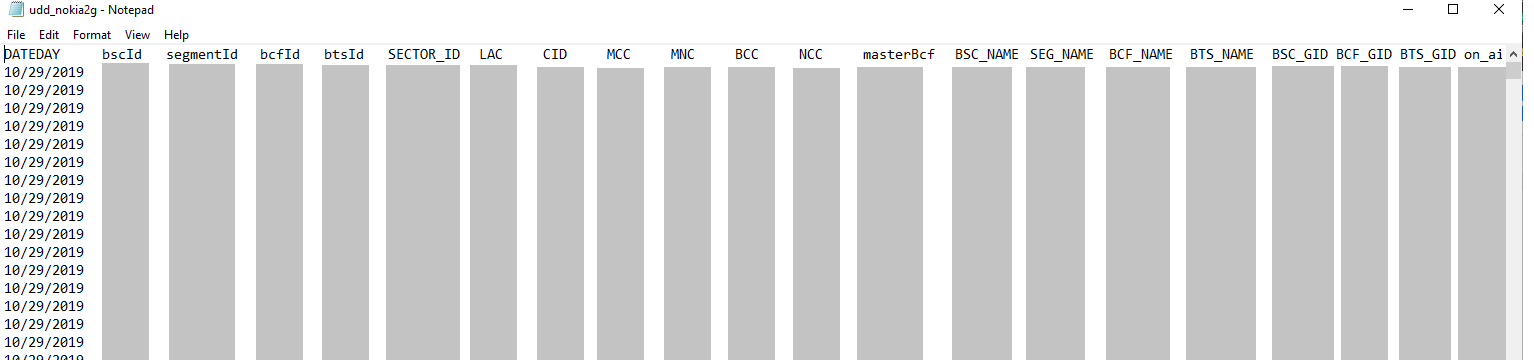
Example of the .txt template
This document must follow a content and naming standard.
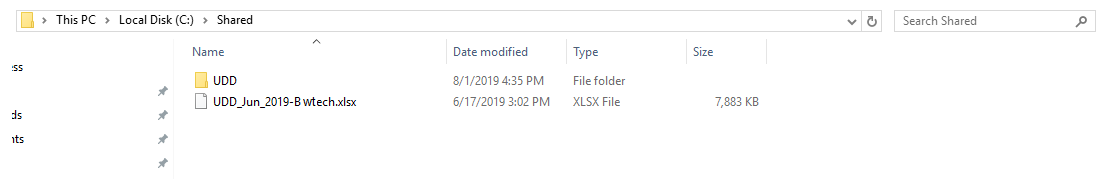
After you complete the template, just put the file in C:\Shared\UDD.
The UDD file is in the project’s Web Server, inside the folder indicated above.
So, every day NetChart will try to take the newest file available in the CM, read it and upload the UDD regions. If there isn’t a new document, then the system will use the last file uploaded.
NOTE: The client defines all the grouping levels (Circle, cluster, RAT Band, etc.). He is also responsible for providing information about the levels in which cells belong to. All the elements that have no classification in the .txt file will go to a folder called Uncategorized.
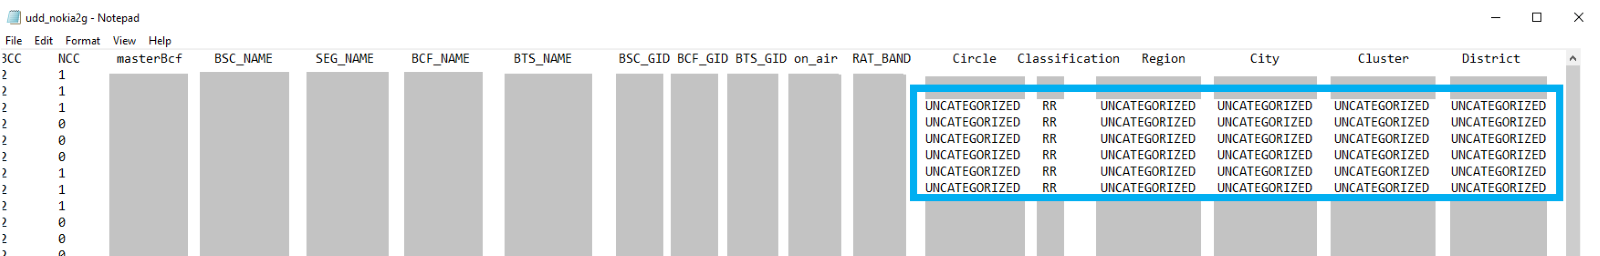
Uncategorized elements in the .txt template
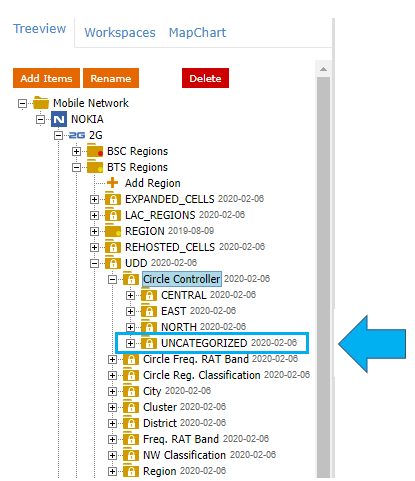
Uncategorized items in the treeview
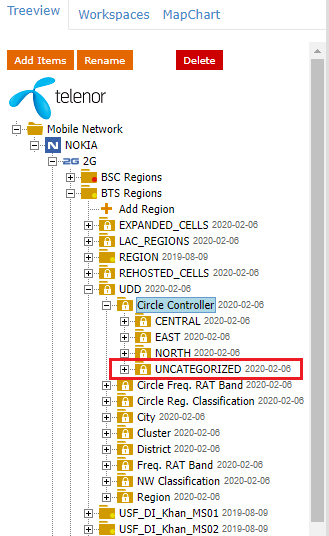
Then, the UDD region creation happens through NetChart code internally.
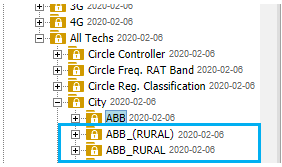
With the UDD regions inserted in the code, they appear in the treeview. They work in a similar way to the custom regions feature.
HOW TO USE
Activating the UDD tracking
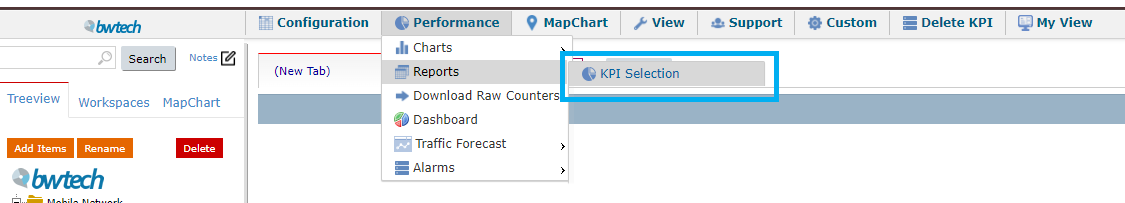
1 – On the superior menu go to Performance, select the Reports option and click on KPI Selection.
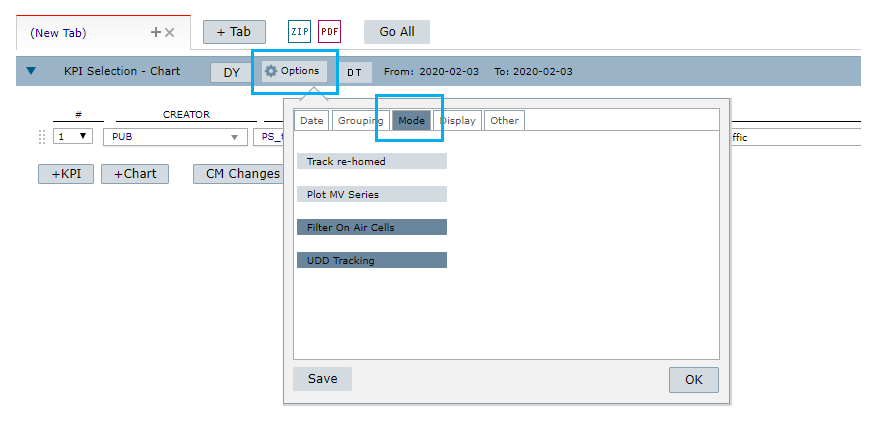
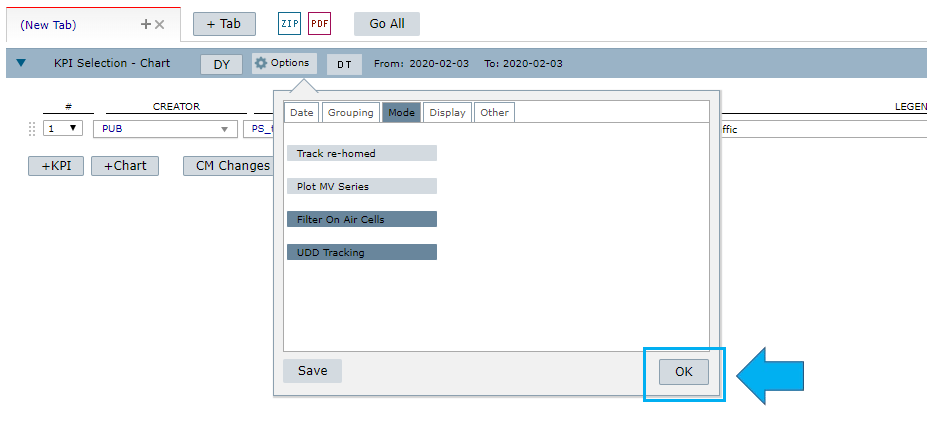
2 – Then, go to Options and click on the Mode tab.
3 – There, select both Filter on air* and UDD tracking** options.
NOTE: The Filter on air option only works if the UDD tracking option is also selected.
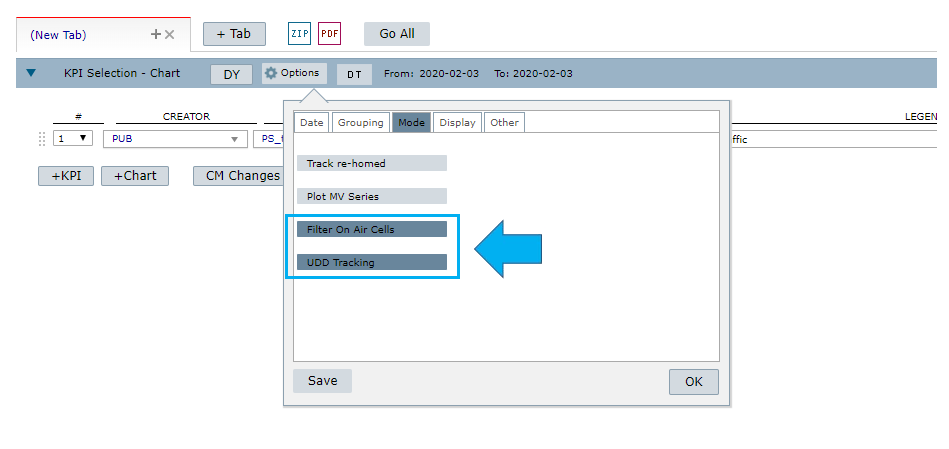
*Filter on air enables the system to filter only the elements that are on air.
**UDD tracking enables the system to use the historical logic. This feature is explained later in this document.
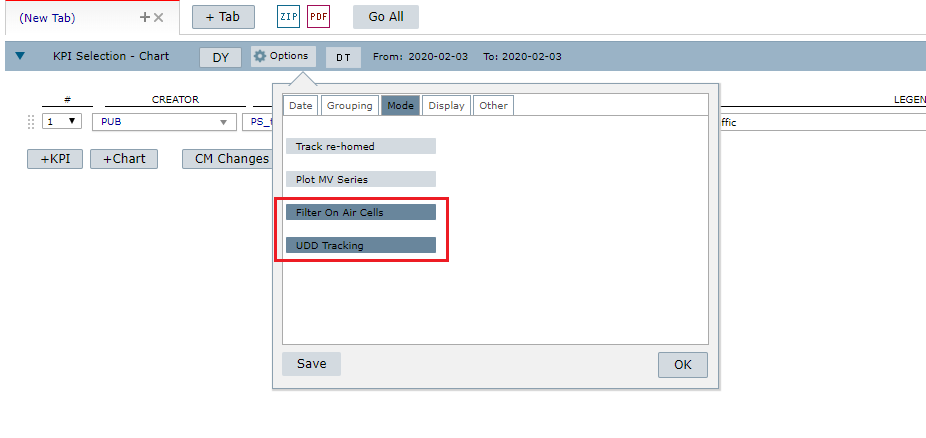
4 – Finally, click on OK and the UDD tracking is active!
Creating an All Techs report
First, make sure that you activated the UDD tracking.
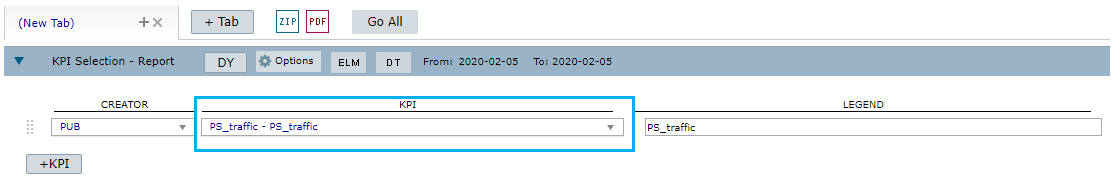
1 – Select the folder, for example, a City.
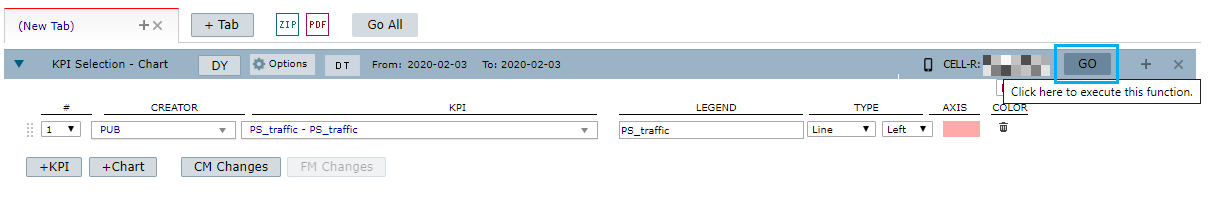
2 – Choose the KPI you want to track.
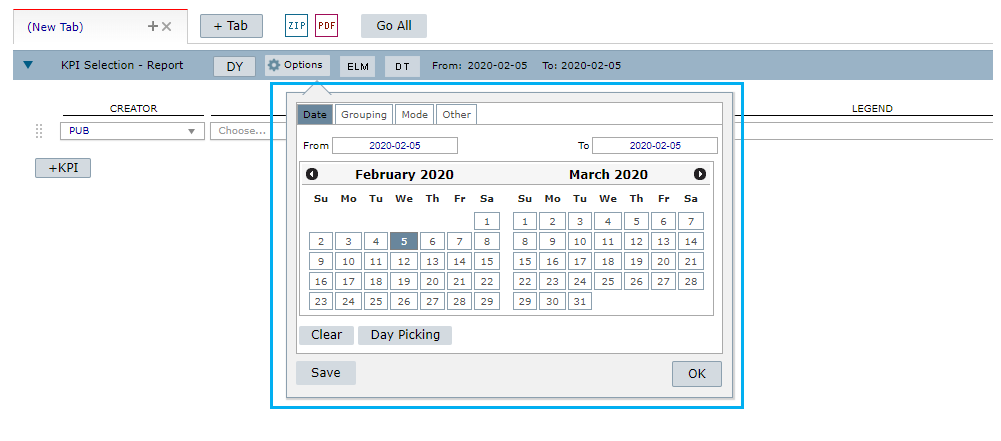
3 – Click on Options.
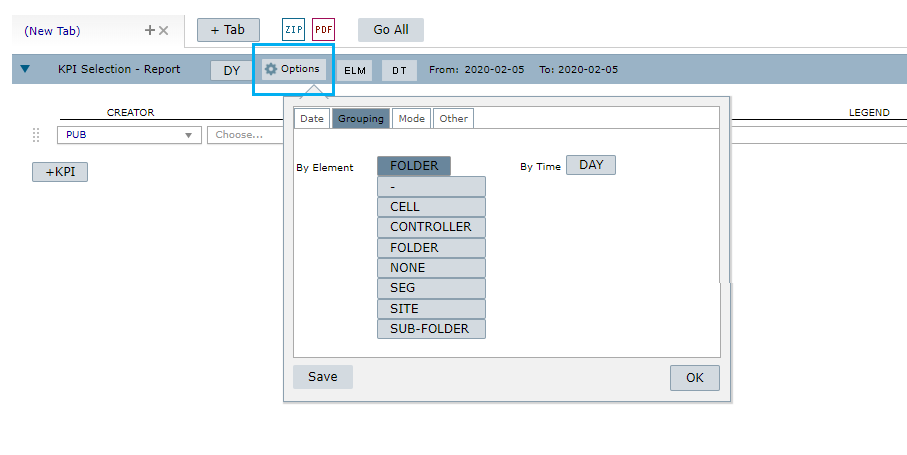
4 – Select the date.
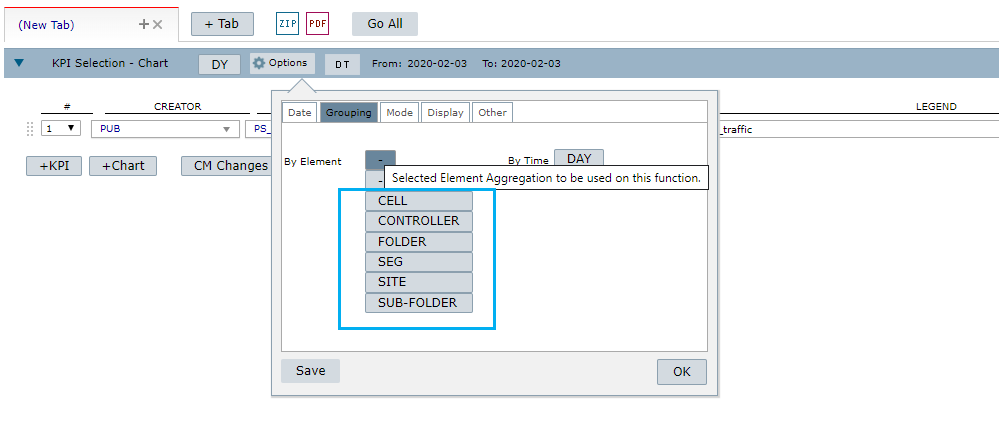
5 – Select the Grouping tab.
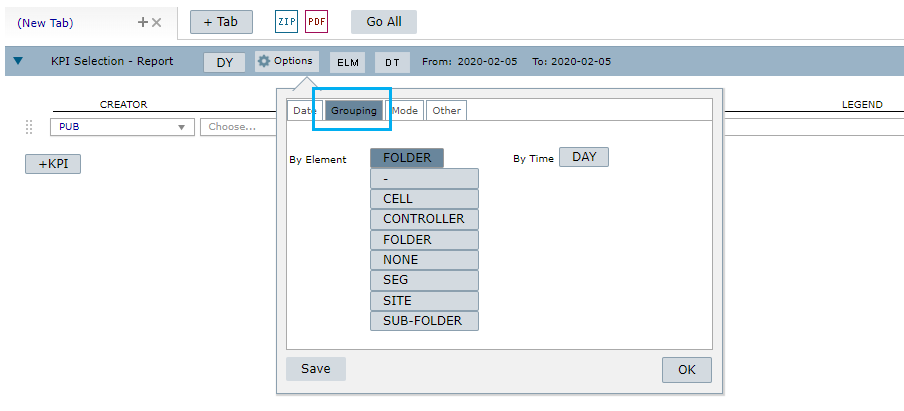
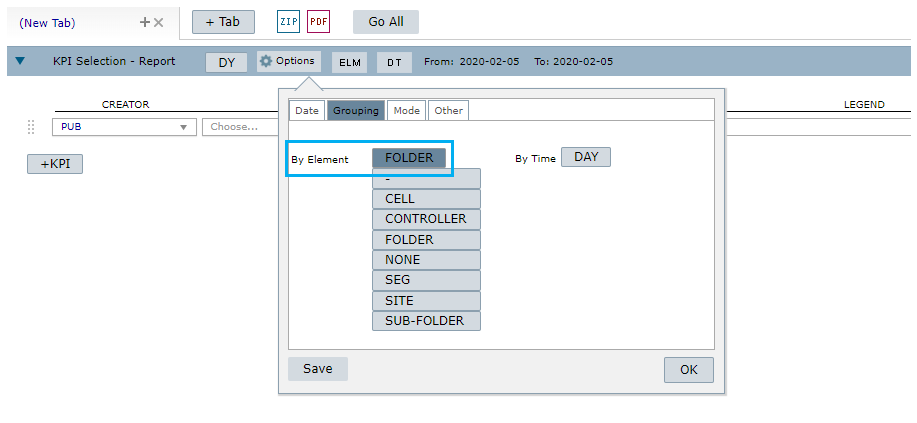
6 – On the By element option and choose Folder.
7 – Click on OK.
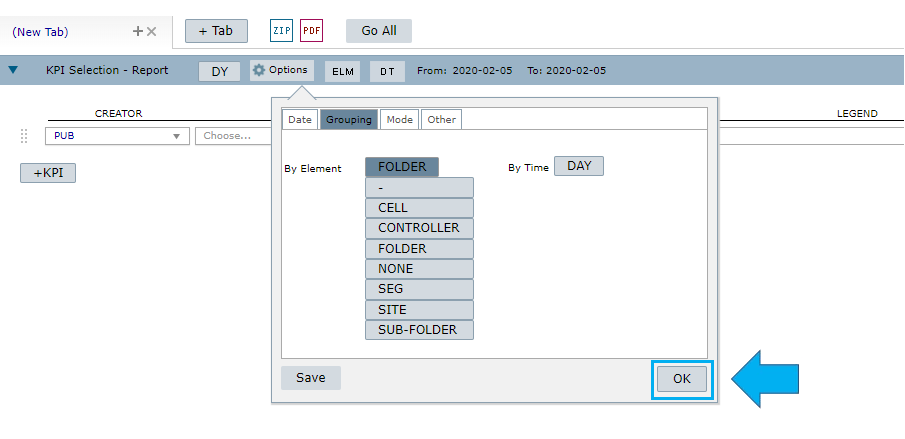
8 – Then, click on Go.
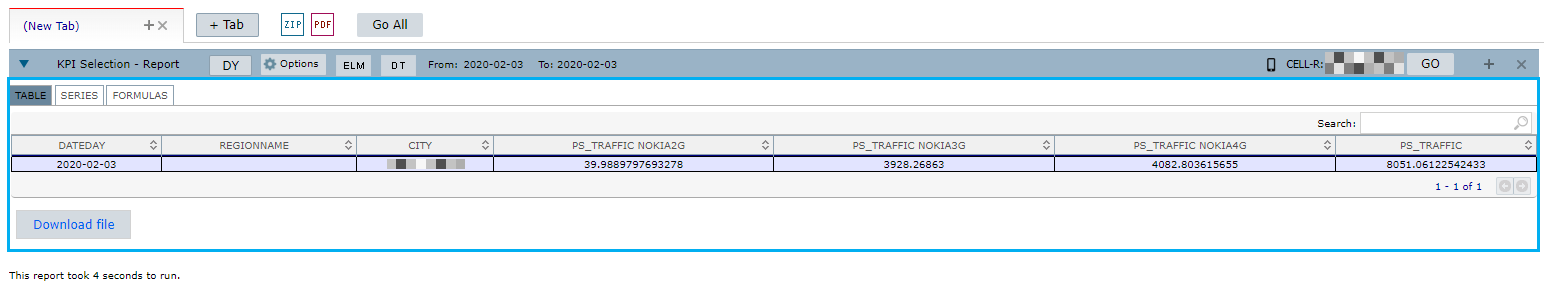
9 – That’s it! Your report is done!
NOTE: There is also the option to create a report by sub-folder, cell, site, segment or controller.
FUNCTIONS DESCRIPTIONS
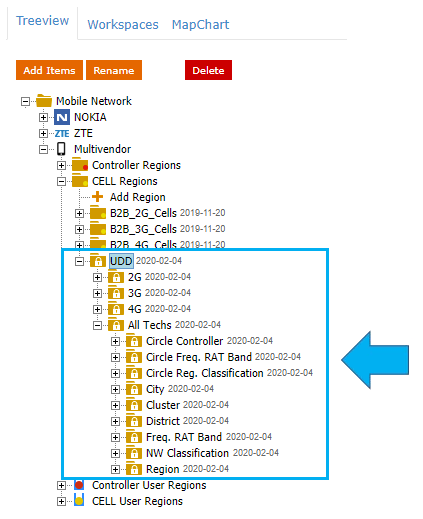
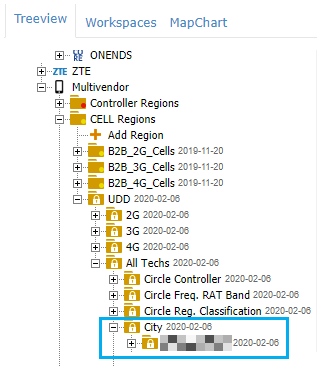
All Techs hierarchy
The All Tech functionality allows the user to gather data of one region not only by multivendor but also by all the technologies available.
It’s found in the treeview, below the Multivendor folder.
NOTE: Depending on the amount of data in the element selected for the report, it can take a little longer to be processed. Normally, an MV_MT report gathers a high volume of data, so the system needs more time to process it all.
Historical data using UDD information
The historical logic is a functionality inside the UDD feature that allows the user to see the KPIs of a specific region taking into consideration the number of classified cells and its status (On Air) exactly in the date or period selected. This means that:
1 – The system searches for the history of the elements.
2 – Understands how they were functioning at that moment.
3 – Gets its historical data to create a report.
It is a way to query data grouped by a UDD classification (circle, city, etc.) that existed at that moment.
Example:
Let’s suppose that on September 21rst in Circle = Central and on Region = South there were 120 different cells with that classification. But on October 10th in that same region, there were 150 different cells.
When the user runs a KPI, he wants the result for all days from September 21rst to October 10th with 120 cells. But from October 4th forward, he wants to consider 150 cells.
Tips
The site and cell names determine if a cell is On Air. As seen above, if a cell contains any restriction tag (_LCK, _DTP, _TOF_ON, _INT, _TOF), it is considered Not On Air, which means that it belongs to an All Cells group.
So, the user can generate KPIs using the historical logic and specify On Air as a filter (so it considers only the cells without those tags). Or he can select All Cells, so no filtering will be applied.
NOTE: When a site has any restriction tags, this means that all his cells are offline or locked. But, when only one cell has the tag, this does not mean that the site it belongs to or all the other cells grouped with it are offline or deactivated.
COMMON ERRORS
- Select only the Filter on air option when activating the UDD tracking.
- Not having a standard of content (like naming the elements and making classifications) when filling the .txt template with the UDDs. Example: misspelling the name of the city – ABB, and AAB. Or naming elements that should belong to the same folder in brackets and without them.