Contents
TRAFFIC FORECAST
Overview
Traffic Forecast is an advanced feature that uses machine learning models to predict network voice and data traffic KPIs.
It helps you focus on taking actions to proactively handle relevant cases. It considers trends, seasonality, and special dates when informed.
Once configured, it automates this type of data analysis for all desired regions and elements, avoiding the manual work of analyzing large volumes of past data with external tools.
NetChart runs all the pre-defined KPI traffic forecasts and threshold rules once a day. All monitored elements or regions that satisfy a rule will generate an alarm informing the element ID or name, KPI ID, the threshold, and the predicted day that the threshold will be crossed.
Since it works with daily data, it focuses on medium-term (days) analysis, not short-term (hours).
All active predicted alarms are available for consultation in a table format, similar to the Logical Alarms feature.
Plot the KPI chart with predicted data through an option in NetChart’s menu.
Initial Setup for Traffic Forecast
Since the traffic forecast feature executes in the background each day to learn the tendencies of the KPIs, it is restricted to a defined set of elements, folders, and KPIs.
Once the Traffic Forecast feature is acquired for your project, specify which elements, regions, and KPIs will be monitored. This list will be available for selection in the interface.
Contact Bwtech’s support team or the project manager to provide the necessary information, and also if you need to change these settings. The following information must be provided:
- Set of elements and folders to be monitored
- Traffic KPIs to be forecasted
- Special dates of the year, such as holidays and events that may have impact in the network traffic
- Alarm configuration: folder/set of elements, KPIs and thresholds.
NOTE: If special dates are not informed, they will be predicted as regular dates according to recent past trend behavior.
How to use
Log in to your NetChart account.
View Traffic Forecast charts
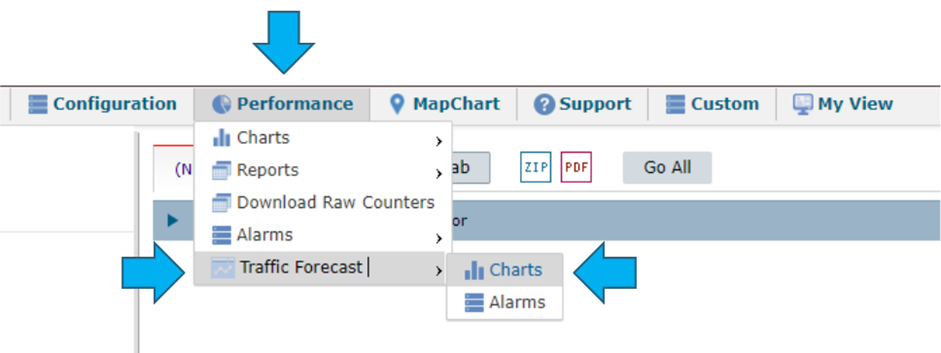
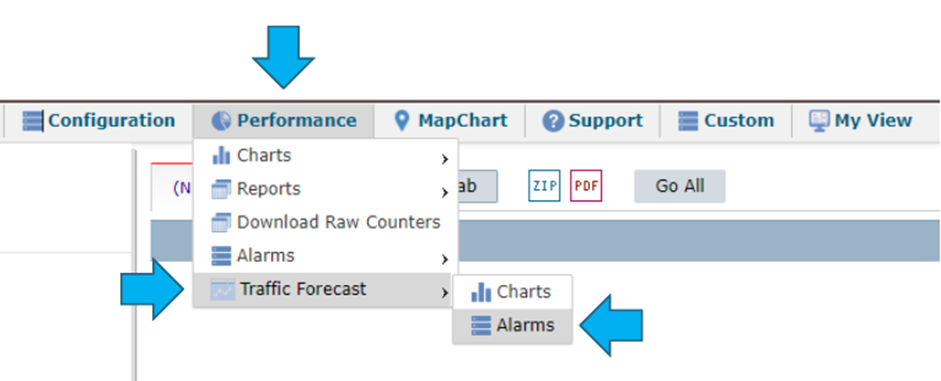
On the top menu, select Performance > Traffic Forecast > Charts.
Define what will be forecasted:
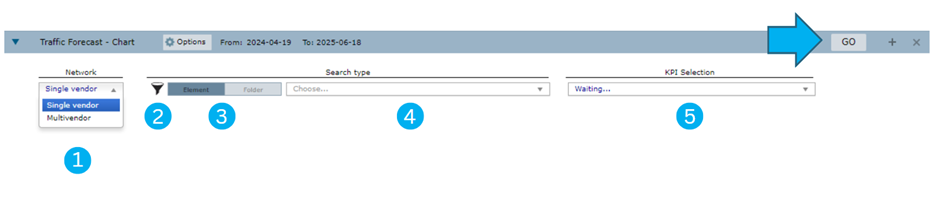
1 – Choose if you want to pick multivendor folders or single vendor elements or folders.
2 – Apply a filter to narrow down to a specific vendor or technology.
3 – Choose between Element or Folder
4 – Select the element of folder
5 – Select the forecasted KPI
Select GO to view the traffic forecast chart.
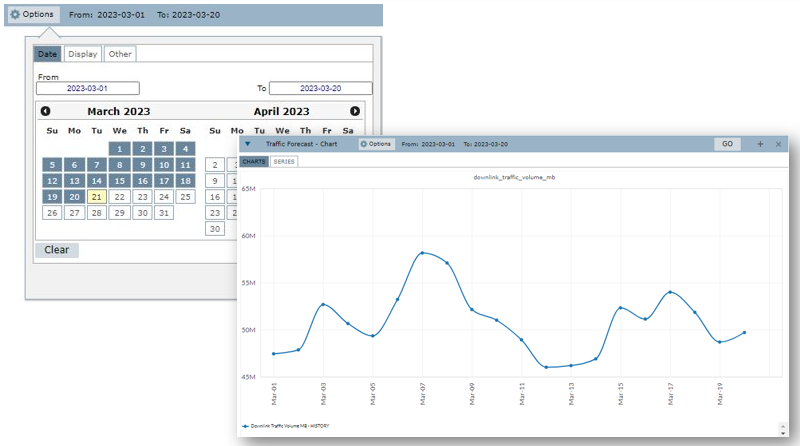
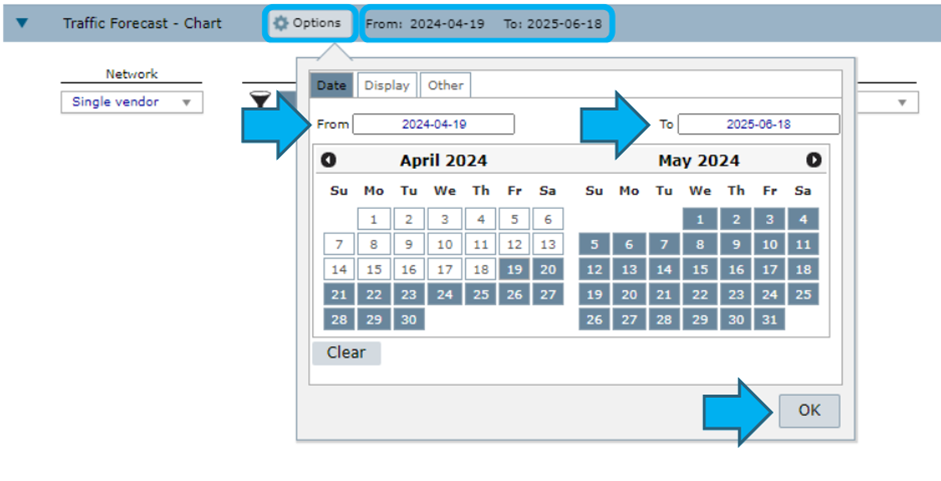
If desired, click on Options or in the dates in the slot header to change the default period in the Date tab. Choose a past date in From and a future date in To within a maximum of 12 months ahead.
Select OK to apply the selected dates.
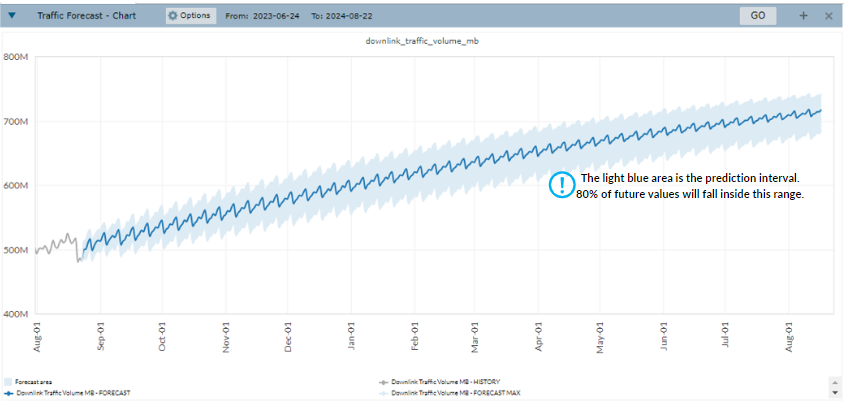
View the traffic forecast chart. History data is represented by the grey line and the traffic forecast data is represented by the blue line.
The light blue area surrounding the blue line is the prediction interval, which predicts future values with an accuracy margin of 80%.
View Traffic Forecast alarms
On the top menu, select Performance > Traffic Forecast > Alarms to view the list of forecast alarms.
Each day, NetChart updates the forecasted trends based on the new data collected the previous day. Therefore, the alarms list is also updated daily to keep only the best predictions.
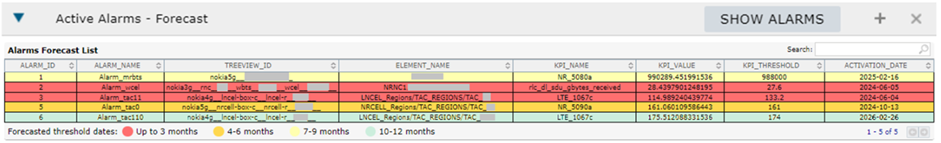
The table provides the following information:
- Alarm ID: unique identifier of each configured alarm
- Alarm name: the name defined for this alarm
- Treeview ID: the path used in the treeview to identify the element
- Element name: the name of the element or folder for which the KPI was forecasted and reached the threshold
- KPI name: the name of the KPI
- KPI value: the forecasted value of the KPI on the date it will reach the threshold
- Activation date: the future date in which the threshold will be reached
The color of the line indicates how close the forecasted threshold dates are.
Common Errors
Wrong date configuration
Choosing a past date in the To area of the Date tab will return a chart that does not show forecast data.