Contents
Account Preferences
OVERVIEW
This feature can be used to set some characteristics of NetChart on your user account. Here you can choose your preferences.
HOW TO USE
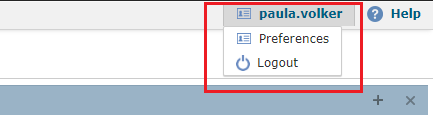
On the NetChart menu, on the top right, click on your user name. Then select preferences.
FUNCTIONS DESCRIPTION
User Preferences
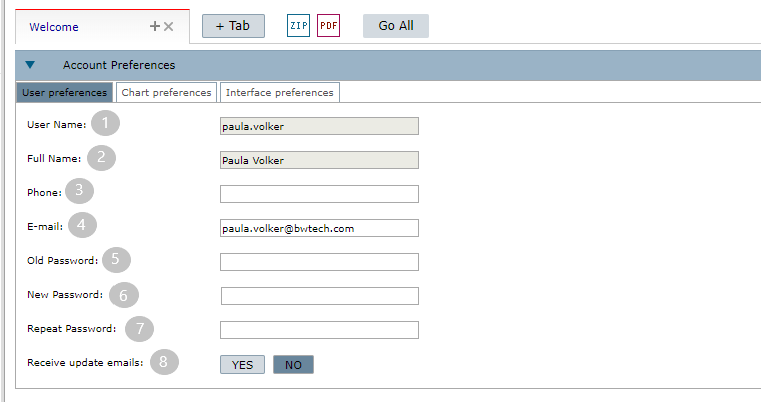
1 – The username.
NOTE: This field can not be changed, if there is an error, contact us on [email protected]
2 – The user full name.
NOTE: This field can not be changed, if there is an error, contact us on [email protected]
3 – The user phone. Please put the country/area code in the number.
4 – The user’s e-mail address. Be sure to maintain this field updated since it is the main contact way between Netchart and the user.
5 – Put the old password to change it.
6 – Type a new one.
7 – And repeat it.
8 – Choose “Yes” in this field if you want to receive emails about the tool updates.
After you finish filling out your user preferences, just click on the Save button, on the upper right.
Chart Preferences
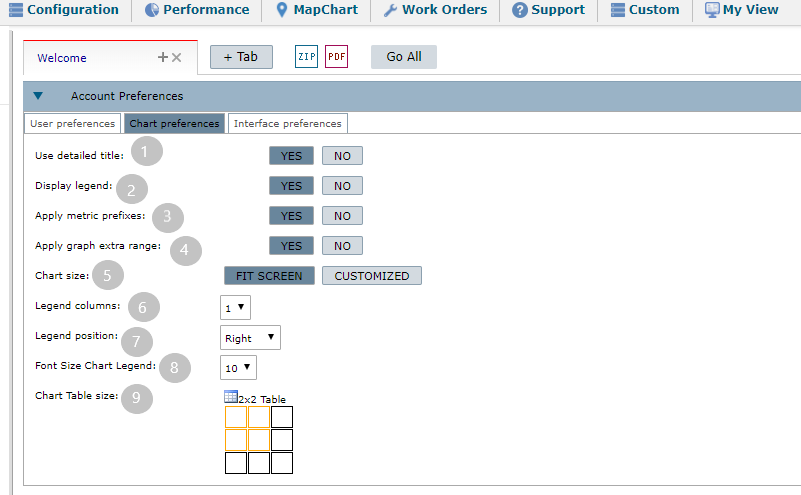
1 – Choose if you want to display a chart with more detailed title, like Function Path – Used Element – Used Date – Aggregation Time
2 – Choose if you want to display the legend by default on the chart.
3 – Here you can choose if you want to apply metric prefixes or not.
4 – And here, if you want your graph to have extra range.
5 – Select Fit Screen to let the size of the graphs suit the current size of your screen.
NOTE: We really advise the users to choose the size ‘fit screen’ with table size ‘2×2’ to visualize better the exported charts. Other good options can be: 800×500, 400×300, 500×400, 640×480.
6 – Here you choose how many columns will your legend use.
7 – The position your chart legend will be.
8 – And the legend font size.
9 – Select the default display mode of the charts.
NOTE: 2×2 means 2 column charts in 2 lines.
After you finish filling out your chart preferences, just click on the Save button, on the upper right.
Interface Preferences
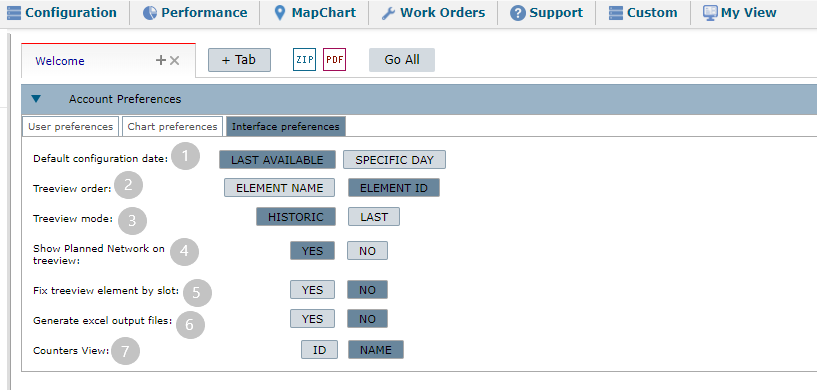
1 – Here you can choose if you want the NetChart’s default configuration date to be the last one available or from a specific day.
2 – Order the elements in the treeview by controller Name or by controller ID.
NOTE: Only the controllers’ order is modified, the other elements of the treeview are always ordered by the id.
3 – Choose the treeview mode.
Historic mode: parameter data from the last 15 days will be used.
Last mode: only data from the last available parameters day will be displayed.
4 – Choose if you want the Planned Network to show on your treeview.
5 – Here you can choose if you want the element selected on the treeview to be locked/fixed when using any NetChart feature.
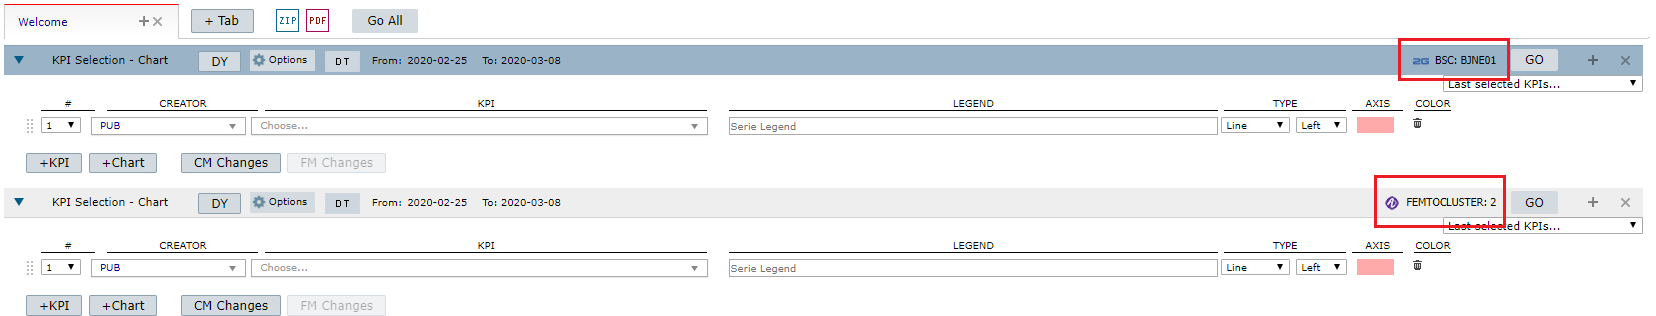
Example: By choosing “Yes” when you want to run a chart of a specific treeview element, it will automatically show in the tab, as shown in the image below.
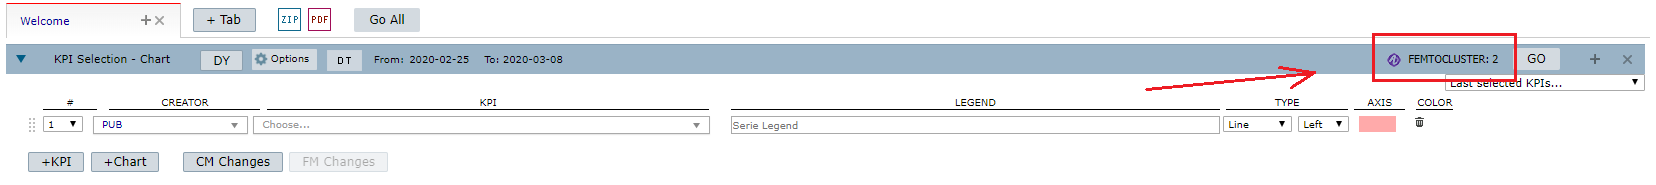 This means that, if you want to run another chart, using a different element, the first one won’t change and a new tab will appear.
6 – Select if you want to get the NetChart results in Excel format, otherwise, the results will be exported into a text document.
7 – Choose if you want the counters to view by name or by ID.
After you finish filling out your interface preferences, just click on the Save button, on the upper right.